
Data visualization brings transparency to semiconductor production

Robert Bosch GmbH
challenges
Central overview of the progress of individual production steps in manufacturing
solution
Target/actual comparison of the individual production steps in semiconductor manufacturing in real time using various Andon boards on monitors in the production hall
benefits
- View data in real time
- Direct connection to the Oracle server
- Easy integration of all required data sources and easy adjustments without IT resources
Time to Value
A working day to create the first dashboard and integrate it into the system
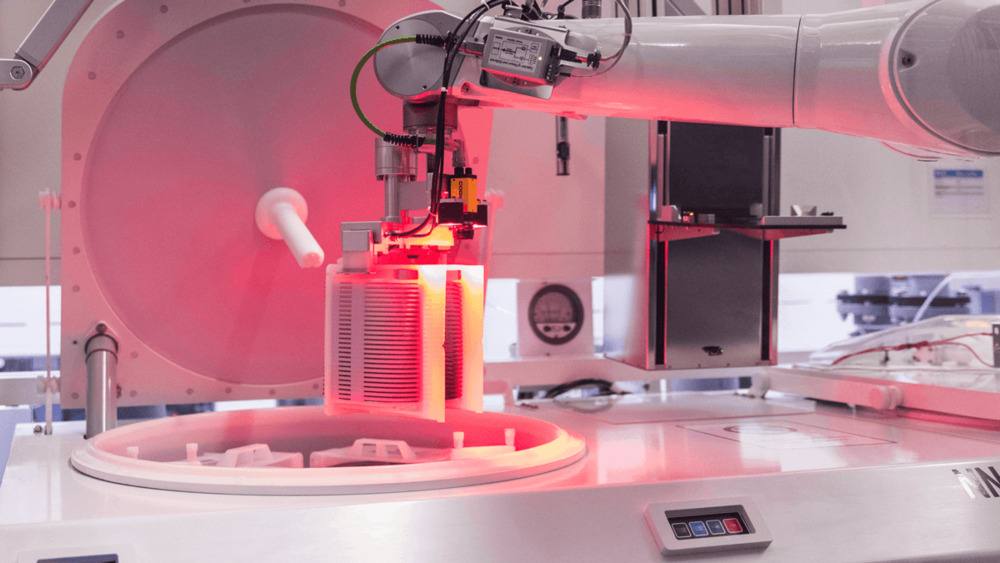
Semiconductors are considered the key technology for the connected world. Bosch is one of the world's leading semiconductor manufacturers. For almost 50 years, the company has been producing various semiconductors that are used in consumer and consumer electronics (cell phones, game consoles), wearables (fitness bracelets, smartwatches or smart glasses) and even in vehicles. To meet growing demand, Bosch built a 200mm semiconductor factory in Reutlingen in 2010. In a complex manufacturing process lasting up to 14 weeks, semiconductor chips are made from raw silicon wafers.
“With Peakboard, all employees always have an overview of where completes are missing, there is a malfunction, maintenance or repair in progress, or where a new production batch can be started to reduce downtime. ”
Manufacturing in the spotlight
Partially automated production covers a very large area, with a single production area comprising several “teeth”, i.e. corridors, for individual production steps.
“Since employees did not have the opportunity to get a central overview of the progress of the individual production steps in their area in one place, they had to go through the production areas regularly to see whether the production plants had already finished processing at one point. These “patrols” not only took a long time, they could also result in completes, i.e. the number of processed wafers or any type of fault, being discovered only after a long period of time,”
explains Benjamin Wagner, from the Equipment Engineering — Lithography division at Bosch. As a result, the quantity produced was unnecessarily below expectations at the end of the day.
“The wish of everyone involved was quickly formulated: to give employees the opportunity to use a visualization at any time at a central location to give an overview of where completes are missing, there is a malfunction, maintenance or repair is in progress, or even where a new production lot can be started in order to reduce downtime.” recalls Wagner.
Bosch had been familiar with data visualization for a long time. Visualization solutions already existed in various areas of production, but they operated in parallel and each met different requirements. It was not possible to cover all requirements with a single system. As a result, adjustments or changes always resulted in a separate programming project and therefore a very high level of effort.
“Our in-house IT department finally gave the impetus to find a visualization solution that could be used universally,” says Wagner.
Create dashboards (almost) at the speed of light
When looking for a visualization solution, it was crucial that the data was presented in real time.
Another requirement was that all required data sources could be easily integrated. The main data source is a Oracle servers, which had to be connected directly. The application should ultimately serve as a standard for all applications in production and adjustments should be able to be made with internal resources.
The choice was made for Peakboard's solution, which meets all requirements.
“The universal applicability of the Peakboard solution immediately convinced us. And since we had already precisely defined our requirements and the type of presentation in advance, the implementation of the first dashboard was very quick,”
Benjamin Wagner, who had taken over project management, explains the process. An Andon board is the best way to visualize the complex production process.
“Together with an employee from Peakboard, we realized the first visualization in a workshop. In total, it only took one working day until our first dashboard was ready and integrated into the system. ”


Data brings light into the dark
that Andon Board, that with the Peakboard Designer Software was designed, is played on a large monitor, which is located at a central location on the ceiling of the production hall. The visualization is updated every 30 seconds so that all information is always up to date. This gives employees an optimal overview of the status quo of ongoing production at any time without having to complete the entire production process.
“Our expectations were met in full. All abnormalities are now immediately identified and colleagues in production are able to immediately take the right action. This has not only made work easier, but also increased satisfaction, as the board is a really big help. ”
Limitless options
Die employees immediately took the new dashboard as a direct assistance in production. The added value that time-consuming checks along production lines are eliminated and at the same time the information enables employees to intervene quickly and thus directly contribute to the success of their work was convincing from day one.
“Of course, the one dashboard with Peakboard didn't stop there: To date, 20 more Peakboard systems have already been implemented into the system in production. We are in the process of creating a standard that ensures that all employees have the same level of information,” says Wagner.
This is important because production runs around the clock in a multi-shift system and workers often have breaks of several days — the information is now recorded even faster because the visualizations everywhere are structured according to the same principles.
Word quickly spread about the success of the Peakboard solution in semiconductor production, so that other areas have already expressed interest in using such a visualization. Thanks to the unlimited design options, a dashboard can be created for every area of the factory. At the moment, 10 more are already planned. However, the potential is far from being exhausted.
Start now with Peakboard and simplify your processes
Turn live data into smart decisions — with Peakboard.
