
DISPLAYS ON SITE
1 Display
EMPLOYEES
18
Data sources


1 License
One license per display

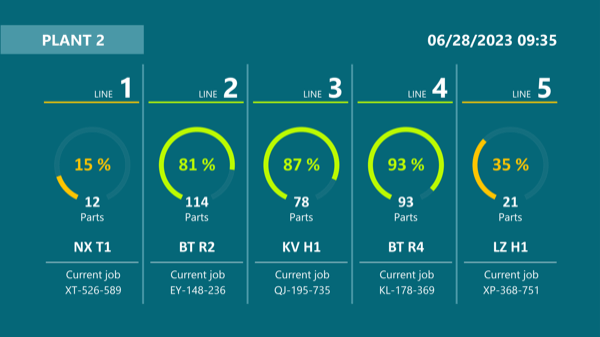
Visualizing production data in real time is a real competitive advantage. With a digital dashboard from Peakboard, you bring KPIs from single, series, and mixed production together in one place—transparent at every level. You spot bottlenecks instantly and steer production on data—with no programming required.


Missing real-time data prevents fast decisions.
High manual effort for data collection and analysis.
Unclear responsibilities lead to communication gaps.
Native SAP connector, OPC UA, MQTT, and dozens of other sources are available out-of-the-box. You just connect, instead of integrating – and the data appears directly at the shop floor.


%201.svg)


%201.svg)


A new metric, a different line, an extra data source—thanks to the low-code editor and Peakbot, you can adapt your production dashboard yourself, without programming skills.
Whether on the Peakboard Box or your own hardware—both run 100% on-prem, with no single point of failure and no cloud dependency.
Device-based pricing instead of user-based licenses: one license per display, unlimited users per device. More employees on the same display cost nothing extra.


Visualizing production data shouldn't take a year. With Peakboard, you start immediately—no appointment, no major IT project.


Start Immediately · No Appointment · Free
If you need support: You'll find tutorials and step-by-step guides on our Helpsite and our YouTube channel. For individual needs, we offer workshops and consulting.
In conversation · With experts · 55 min.
Discuss your specific use case with an expert – briefly provide information about your use case beforehand, and we'll get straight to the point.
You'll get a complete overview of all features and see what's possible with Peakboard in your environment.

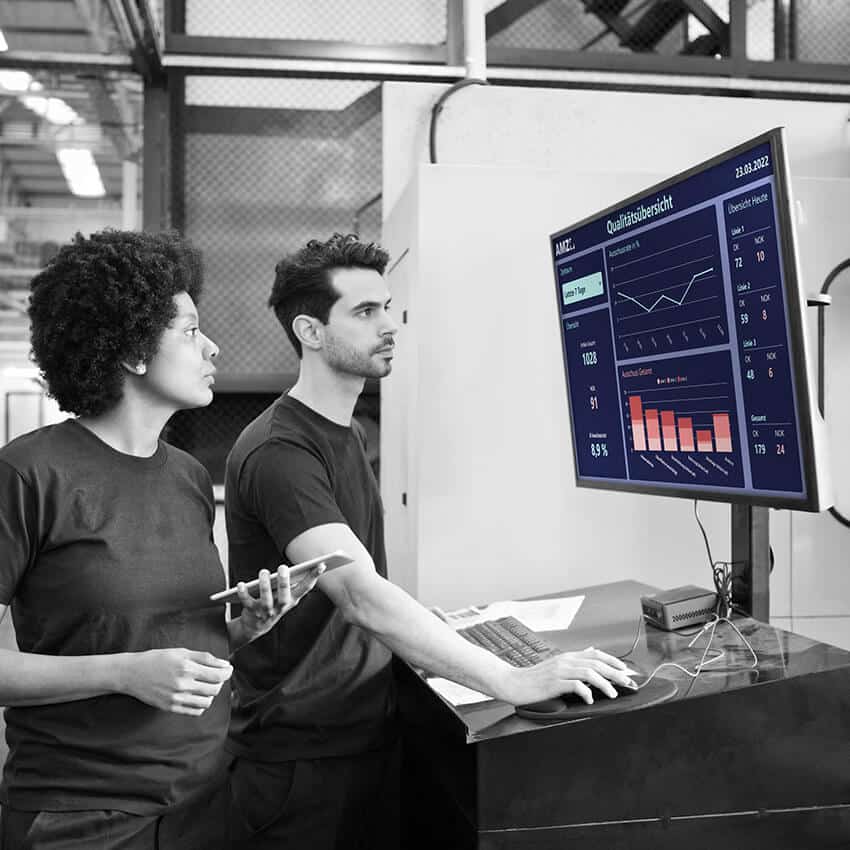
Production outages and inefficient processes can result in high costs. By collecting your production data digitally and visualizing it in real time, you get a clear overview of current processes and bottlenecks. This allows you to react immediately before major disruptions or delays occur.
Data-based manufacturing also increases team motivation: all parties involved can see at a glance whether production is on target and which quality requirements apply. This promotes a common understanding of goals and indicators and leads to greater efficiency across the entire value chain.
Data collection & integration
Peakboard seamlessly integrates your existing systems — from ERP or MES databases to machine data via OPC UA or Siemens S7. You can also connect JSON and XML feeds as well as local files (such as Excel). This gives you a comprehensive overview of all production data.
Configuration & Customization
With Peakboard Designer, you create individual dashboards including desired KPIs, design elements and alarm rules. The low-code approach makes it easy to set up without extensive IT knowledge — tailored to your processes.
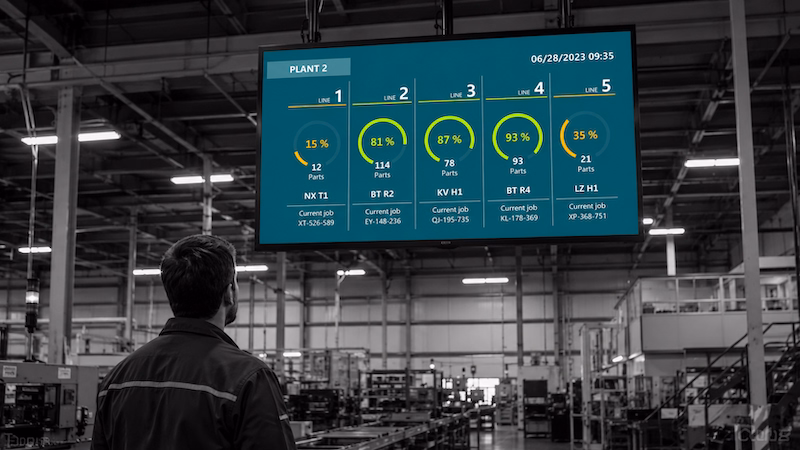
Real-Time Visualization
Depending on the infrastructure, your data can be displayed either via the Peakboard Box or via Peakboard BYOD (Bring Your Own Device). The dashboards are constantly updated so that your teams always have access to the latest key figures — whether on the shop floor or in the office.
Write-back & analysis
Changes to production progress or machine parameters can be written back directly to the source system to avoid duplicate data maintenance. At the same time, all relevant information is stored in the Peakboard Hub, which allows you to analyze trends in the long term and better identify optimization potential.
Peakboard offers you a scalable solution that is suitable for both small production lines and globally networked corporations. Thanks to a low-code approach, dashboards and applications can be created or adapted in no time — without complex IT projects. For companies that attach particular importance to security, Peakboard also enables local operation without an external cloud, so that sensitive production data remains in-house. This flexibility and independence results in noticeable time and cost savings: Manual data collection is reduced to a minimum, downtime is avoided thanks to a real-time overview and proactively optimizes production processes.