DISPLAYS ON SITE
1 Display
EMPLOYEES
18
Data sources


1 License
One license per display

Downtime tracking makes every machine stoppage visible in real time—with duration, cause, and impact. With Peakboard, you capture faults automatically, analyze the reasons, and sustainably reduce unplanned outages—for higher OEE, with no programming required.
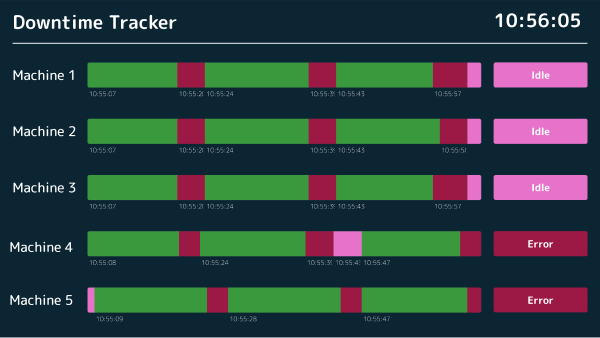


Unplanned downtime causes costs, delays, and delivery issues.
No real-time data: causes and frequency remain unclear.
No fast response to recurring downtime possible.
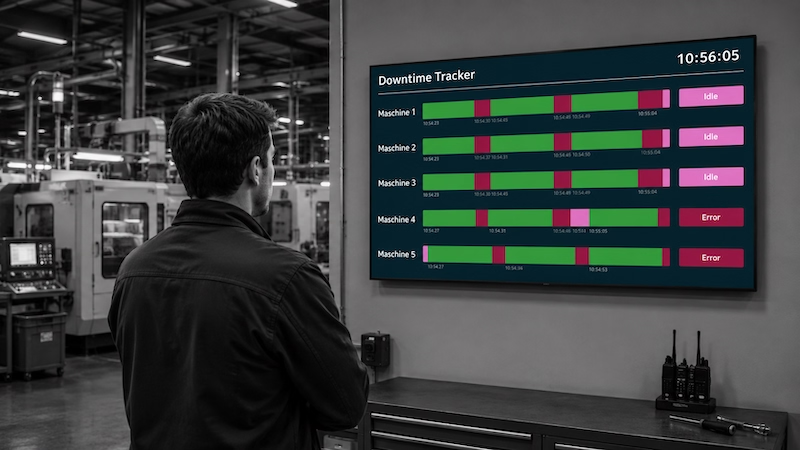
Native SAP connector, OPC UA, MQTT, and dozens of other sources are available out-of-the-box. You just connect, instead of integrating – and the data appears directly at the shop floor.


%201.svg)


%201.svg)


A new machine, a different error code, an extra metric—thanks to the low-code editor and Peakbot, you can adapt downtime tracking yourself, without programming skills.
Whether on the Peakboard Box or your own hardware—both run 100% on-prem, with no single point of failure and no cloud dependency.
Device-based pricing instead of user-based licenses: one license per display, unlimited users per device. More employees on the same display cost nothing extra.



Introducing downtime tracking shouldn't take a year. With Peakboard, you start immediately—no appointment, no major IT project.


Start Immediately · No Appointment · Free
If you need support: You'll find tutorials and step-by-step guides on our Helpsite and our YouTube channel. For individual needs, we offer workshops and consulting.
In conversation · With experts · 55 min.
Discuss your specific use case with an expert – briefly provide information about your use case beforehand, and we'll get straight to the point.
You'll get a complete overview of all features and see what's possible with Peakboard in your environment.

Unplanned machine stops are real productivity killers. With Peakboard, you visualize downtime in real time, recognize patterns, and take immediate action — without paper forms or Excel lists.
Stoppages are only one part of the machine data; which other signals can be evaluated is covered on the page about machine monitoring software.
Connect Peakboard directly to your machine control system or MES — for example via OPC UA, Siemens S7, MQTT, or SAP. Every machine stop is recorded automatically, and operators can add the reason manually by touch. Durations, causes, and frequency are visualized live on a dashboard, so you can run root-cause analysis and cut recurring downtime — no programming required, live in a few days.
Peakboard is downtime tracking software that connects to your machine control system or MES via OPC UA, Siemens S7, MQTT, or SAP and records every stop automatically. Operators add the reason by touch. Durations, causes, and frequency appear on a live dashboard — no separate MES project, and no programming.
Unplanned downtime is the biggest productivity killer in manufacturing. Systematic tracking shows which machines fail most often, which causes dominate, and where preventive maintenance pays off — turning downtime into a measurable, improvable metric instead of guesswork.
Peakboard reads machine signals via OPC UA, Siemens S7, MQTT, or from SAP PM and MES systems such as FORCAM FORCE or MPDV HYDRA. Stoppages are classified automatically or linked to a cause manually on a touchscreen, and all data flows into the Peakboard Hub for historical analysis.
Yes. New machines, changed cause categories, or additional KPIs are adjusted in the Peakboard Designer by drag and drop or with Peakbot, the built-in AI — no IT ticket.
Peakboard runs fully on-premises on your own network. Machine data never leaves your plant, and there is no cloud requirement and no single point of failure.