
More than just low-code visualization

Bon EOOD
challenges
Set up a complete MES quickly and display the status quo in production in real time
solution
Integration of 43 Peakboard products at individual stations in the company to visualize production data in real time
benefits
- Visibility of orders and production progress
- The current status can be mapped at any time through real-time data access
- Higher employee motivation through transparency about their own work performance
Time to Value
One week until the first full integration
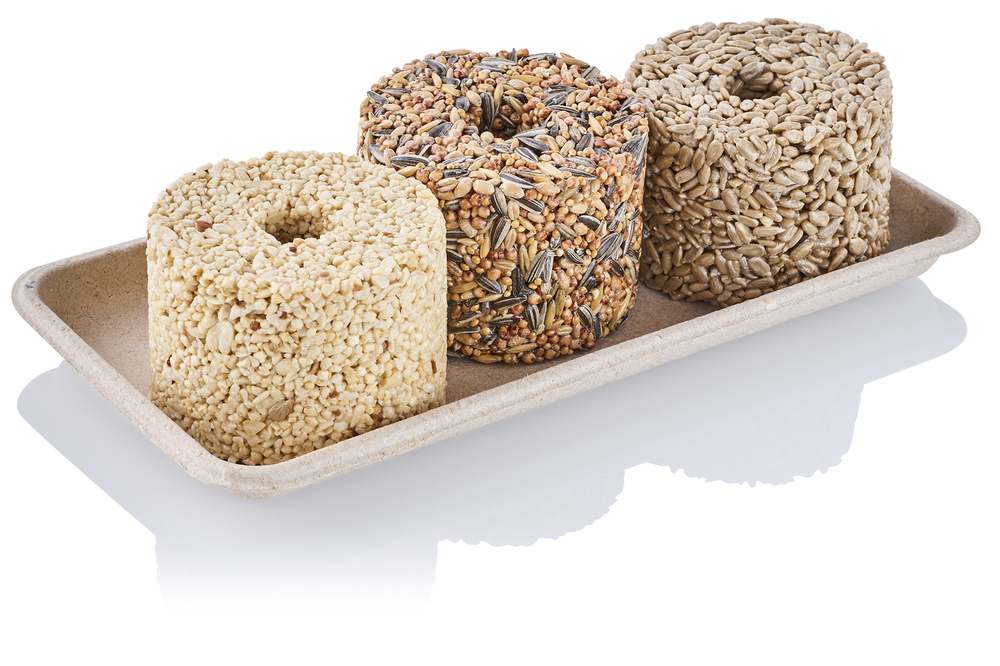
Bon EOOD is a Bulgarian company founded in 1994 with the largest portfolio of wild bird feed products in Europe, USA and Canada. The 350 employees cover the entire supply chain, from raw materials to end users. There is an assembly line with semi-automated workstations. In summer, the demand for the main season in autumn and winter is pre-produced.
“The effects were consistently positive. The overall effectiveness of production has increased and our planning is more accurate. Our processes have also significantly accelerated thanks to MES functions. Our teams are even more motivated than before and develop sporting ambition to achieve the goals.”
Older machinery, rough estimates and forecasts
The teams know the type and quantity of products to be manufactured within an order. However, forecasts of how long it will take to process an order are based on rough estimates based on experience, as well as extrapolations of one-day test productions. The current stand The production is unknown. The company checks inventories on a weekly or monthly basis. When a goal is achieved, there is a note in an Excel spreadsheet.
Orders are increasing, so Bon EOOD is expanding production and adding several production lines.
“We needed a professional solution that shows the status quo in real time to let customers know by when we could complete an order,” explains Mityo Dryankov, Director Maintenance, Innovations and Technology at Bon EOOD. “We also wanted to communicate a goal to our employees and integrate them more closely into the overall context of the company. We also needed a better basis for making strategic decisions. ”
Reliably functioning and low-code
First, Dryankov is testing a server-hosted solution. However, this proved to be too expensive. Peakboard is then selected. “We've seen that Peakboard isn't a one-man show like some of the competitors. In addition, the low-code system was flexible enough to swiftly into our production lines to implementing” says Dryankov.
An initial discussion, in which Bon EOOD checks the basic feasibility, is followed by a joint workshop. Here, production processes and logics are recorded and the visualization goals are defined, with the main focus on the question of which data the individual KPIs consist of.
At the workshop, there is another need that goes far beyond pure visualization.
“When we saw what was also possible with Peakboard, we expanded the project. We were now planning to set up a complete MES and booked ten days of consulting as well,” recalls Dryankov.

An MES instead of pure visualization
In the beginning, however, neither the machines nor the ERP system can be connected, meaning that there are hardly any directly usable data sources. Peakboard provides the information as part of a quick Retrofitting available by using the hardware component, Peakboard Edge, a light barrier is connected, which digitally captures the signals and makes them available for further use. The exact number of finished products, which was previously only estimated, is now recorded without intervention in the system control system. The solution assigns them to the job and a shift and shows the degree of goal achievement. The Shift Race is created: a playful competition between different layers. “We set up our counting system ourselves using sensors and light barriers, but we relied on Peakboard's support for the rest,” explains Dryankov. The sensors send the data to Peakboard's edge solution. From there, it continues via an SQL server to the dashboards.
Bon EOOD can also create orders independently and feed them into the system. They appear together with their Real-time processing status instantly on the dashboards. In order to create analyses for production optimization, Bon EOOD also accesses a database in which all orders are stored. It allows filtering by lines, shifts, degree of target achievement, incorrect production and interruptions. Data is saved every 2 minutes. Even after a possible power failure, the solution is quickly ready to go again. This is made possible by specially implemented fallback functions.
A total of 43 Peakboard products are in use. The dashboards are placed above the production lines. On the shift manager's desk, all information from the entire shift is brought together on an additional display.
Start now with Peakboard and simplify your processes
Turn live data into smart decisions with Peakboard.
