Visualize production data: More transparency for your production
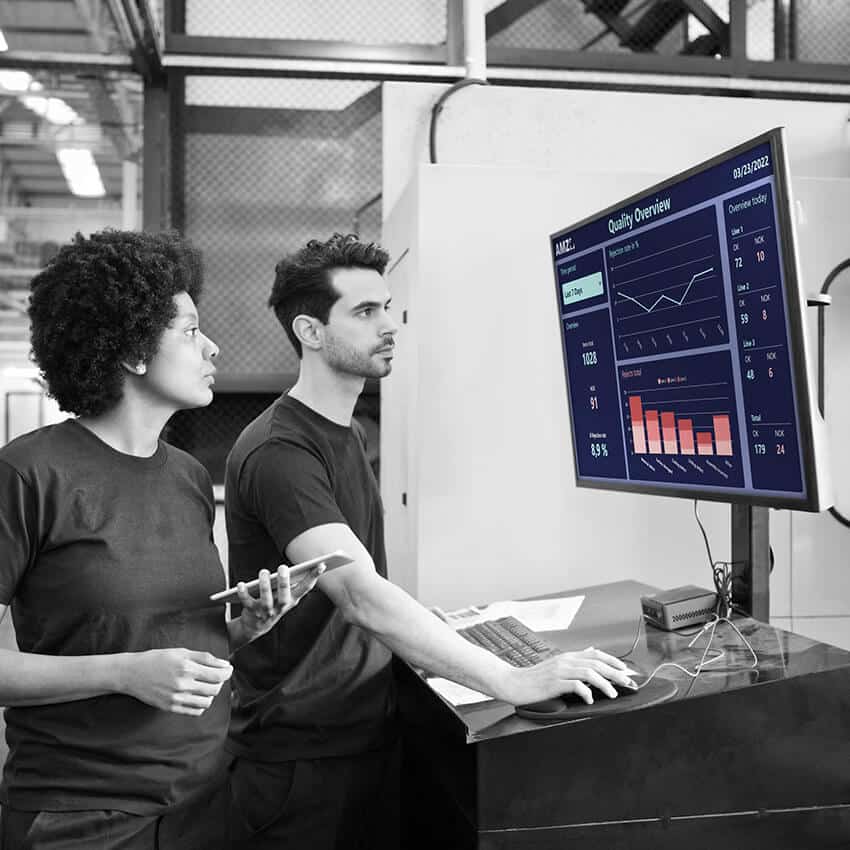
Visualising production data in real time is a real competitive advantage. With a digital dashboard from Peakboard, you bring KPIs from single, series and mixed production together in one place – transparent at every level. You spot bottlenecks instantly and steer production on data – with no programming required.


Real challenges, smart solutions, visible results
With Peakboard, you turn typical production obstacles into real competitive advantages. Find out how our solution actually works and what measurable results you can expect.
Challenge
- Lack of real-time data prevents quick decisions
- High manual effort for data collection and evaluation
- Unclear responsibilities lead to communication gaps
Solution with Peakboard
- Real-time visualization of relevant production data
- Automatic alarms in case of deviations and faults
- Intuitive dashboards for efficient exchange of information
Result
- Quick responses and reduced downtime
- Increased productivity through transparent processes
- Sustainable cost reduction and continuous process optimization
Fully adaptable to your needs
Shop Floor Management
As flexible as your processes.
With Peakboard, you create a centralized and flexible solution for your daily shop floor communication – perfectly tailored to your individual workflows.

- Standardised SQDC reports for a quick overview of the regular meeting
- Define your own key figures – manually or automatically
- Capture, edit, and track measures — structured and team-oriented
- Assign responsibilities with notifications via email, MS Teams, or Slack
- Adjust menu structure and content to fit your department’s needs
- Store historical data and analyze it with Power BI, QlikView, or Tableau
Discover how flexible shop floor management can be with Peakboard
All of your data.
One platform.
Peakboard connects your systems and brings all data to one platform — for visualization, automation and individual applications.


%201.svg)


%201.svg)


How to bring transparency and speed to your processes in 30 days
Implementing new software shouldn't take a year.
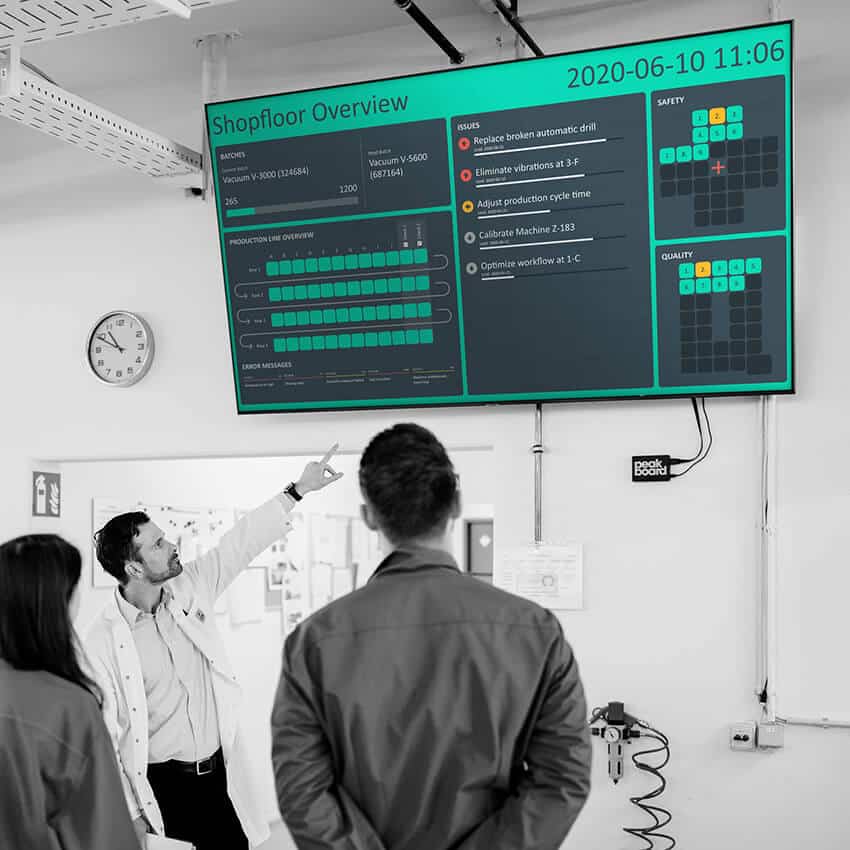
Get started for free with Peakboard Designer
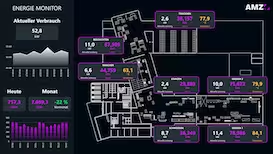
Create your digital production dashboard to see all important production data at a glance and react immediately to discrepancies. With our template, you can visualize production figures in real time and optimize processes efficiently — without any programming knowledge.

Production outages and inefficient processes can result in high costs. By using your production data Collect digitally and visualize in real time, you get a clear overview of current processes and bottlenecks. This allows you to react immediately before major disruptions or delays occur.
One data-based manufacturing It also increases team motivation: All parties involved can see at a glance whether production is on target and which quality requirements apply. This promotes a common understanding of goals and indicators and leads to greater efficiency across the entire value chain.
This is how the Peakboard system works
Data collection & integration
Peakboard seamlessly integrates your existing systems — from ERP or MES databases to machine data via OPC UA or Siemens S7. You can also connect JSON and XML feeds as well as local files (such as Excel). This gives you a comprehensive overview of all production data.
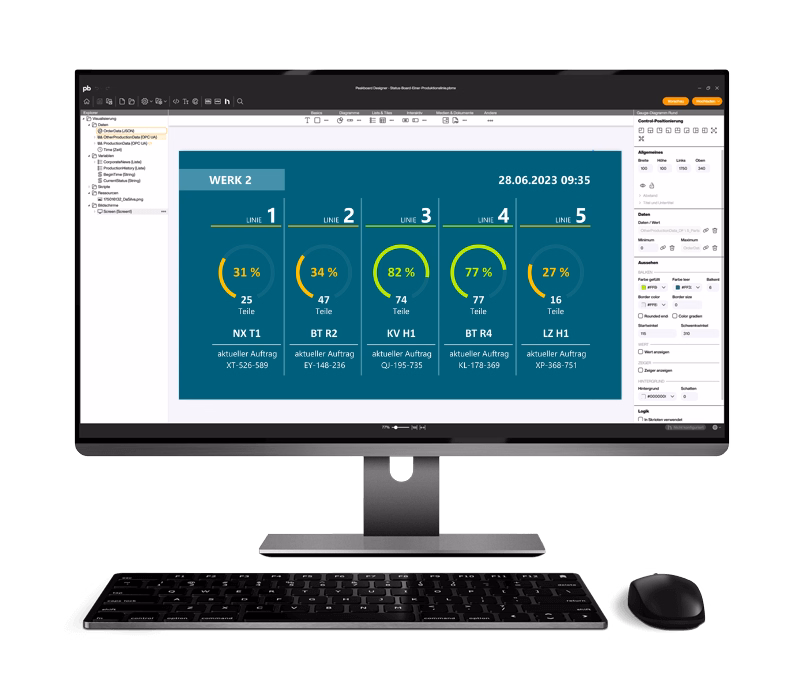
Configuration & Customization
With Peakboard Designer, you create individual dashboards including desired KPIs, design elements and alarm rules. The low-code approach makes it easy to set up without extensive IT knowledge — tailored to your processes.
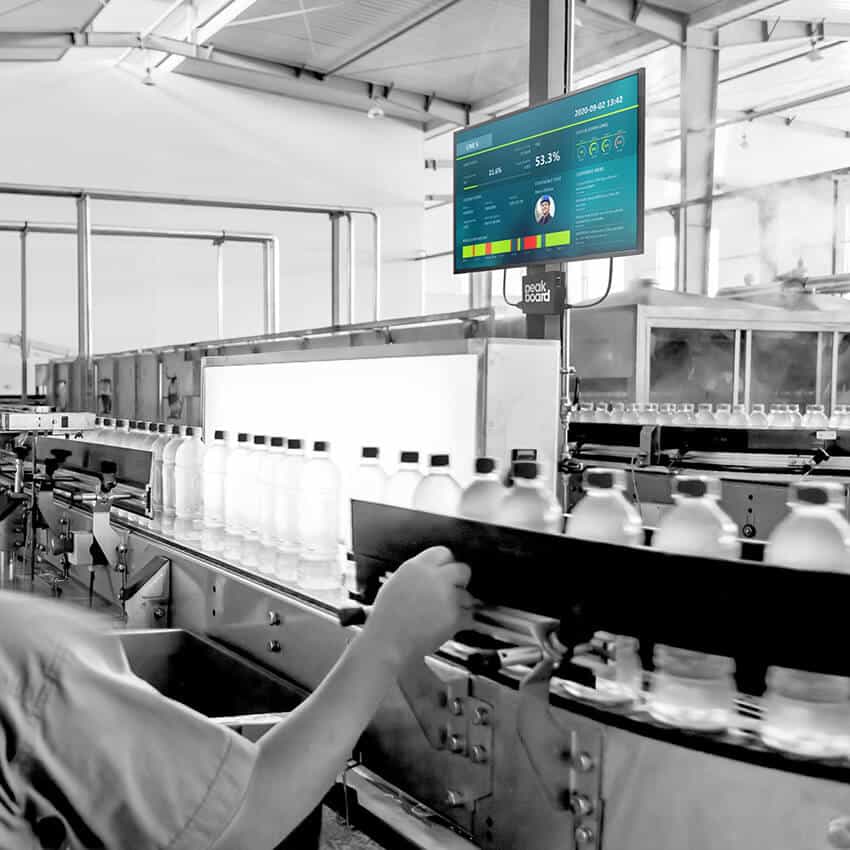
Real-Time Visualization
Depending on the infrastructure, your data can be displayed either via the Peakboard Box or via Peakboard BYOD (Bring Your Own Device). The dashboards are constantly updated so that your teams always have access to the latest key figures.
Write-back & analysis
Changes to production progress or machine parameters can be written back directly to the source system to avoid duplicate data maintenance. At the same time, all relevant information is stored in the Peakboard Hub.
The most important functions of digital production data visualization
- Live data from various sources
Integrate ERP, MES, or sensor data to get a holistic view of the manufacturing process. - Traffic light system & alarm functions
Identify discrepancies immediately and use automated notifications to prevent failures or quality deficiencies. - Easy to use dashboard
Set KPIs like OEE, cycle times or rejection rates — adapted to your corporate design and the needs of your teams. - Interactive control
Employees can use touch screens or tablets to update machine status or order progress and write back to the source systems as needed.
Key figures when visualizing production data
- Overall equipment effectiveness (OEE): Measures how effectively systems are running compared to their ideal state.
- Turnaround times: Identifies bottlenecks in manufacturing and shows where processes can be accelerated.
- Scrap & error rates: Enable direct quality control and cost reduction through less rework.
- Employee workload: Provides clarity as to whether personnel resources are being used optimally.
Benefits of visualization with Peakboard
Peakboard offers you a scalable solution that is suitable for both small production lines and globally networked corporations. Thanks to a low-code approach, dashboards and applications can be created or adapted in no time — without complex IT projects. For companies that attach particular importance to security, Peakboard also enables local operation without an external cloud, so that sensitive production data remains in-house.
Used by industry experts
to cleverly simplify processes.

“Easy implementation and use was important to us. Peakboard offered many standards in the SAP environment and was able to integrate all data sources without programming effort. In addition, even before making the decision, I noticed that we could use the graphical interface intuitively and easily adapt it. ”
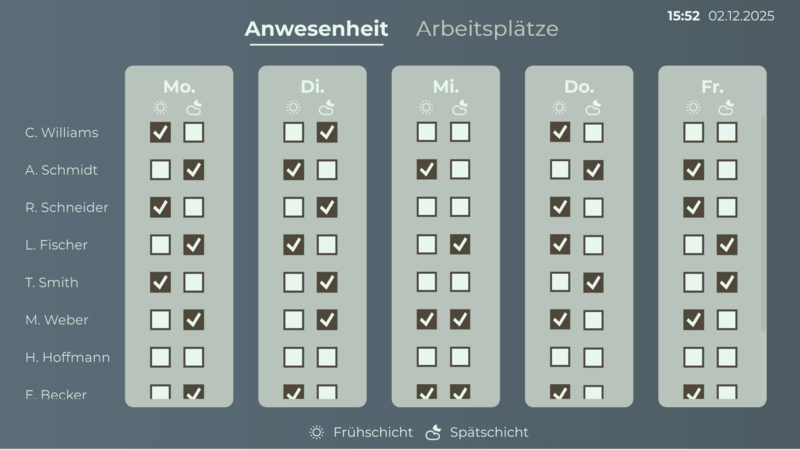
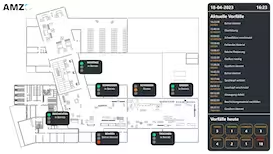
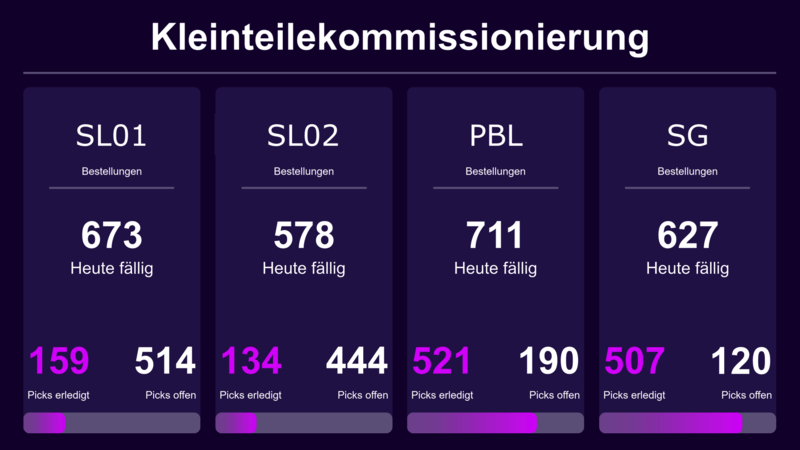
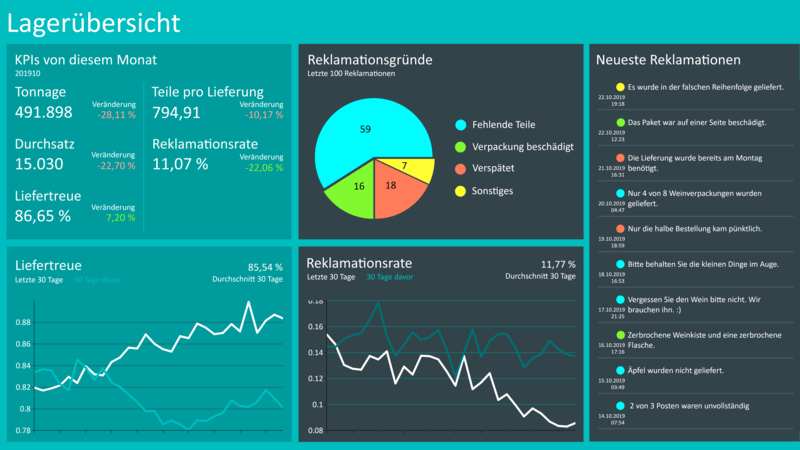
Save time with our templates
No time for long designs? No problem: Use one of the many ready-made templates for dashboards and applications — e.g. for production monitoring, warehouse management or quality assurance. Pick a template, customize it, and you're done.