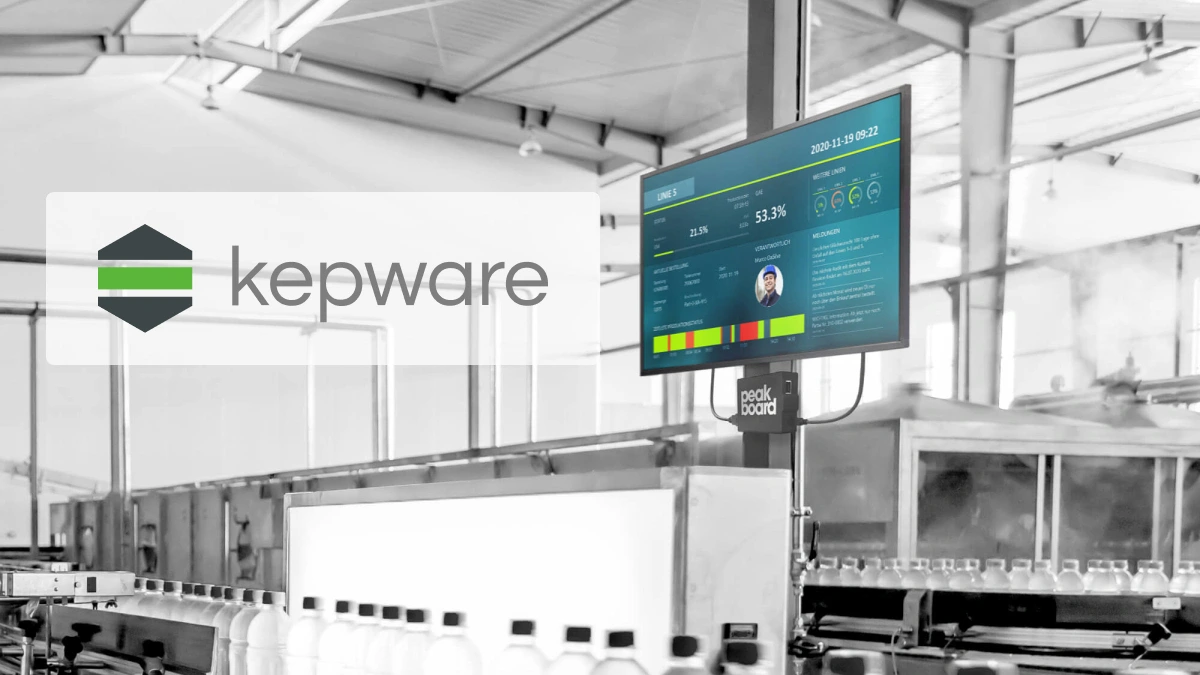
Data connection with
Kepware
- Central OPC UA/MQTT connection for over 150 machine types
- Visualize real-time dashboards & BI-ready data with Peakboard
- Historization, interaction & write-back directly from the dashboard


One interface for everything—with Kepware & Peakboard
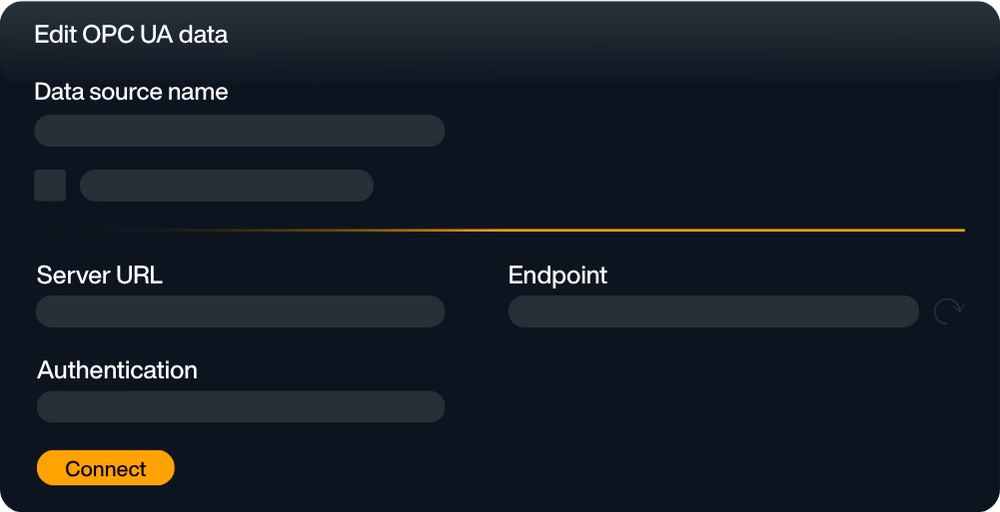
With Kepware as an industrial gateway, you connect a wide variety of machine controllers — such as those from Siemens, Allen-Bradley, Beckhoff, or Phoenix Contact — using a uniform protocol such as OPC AND OTHERS or MQTT. Peakboard docks directly to your Kepware OPC UA server (such as KEPServerEX) and transfers the machine data bundled there into real time visible, controllable and usable.
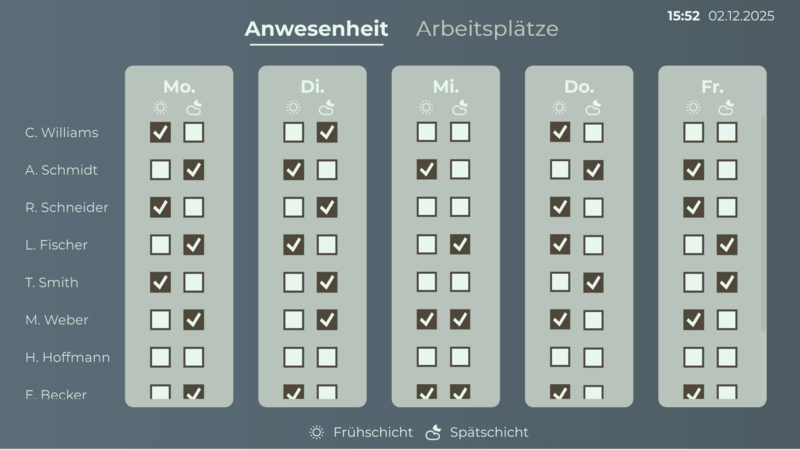
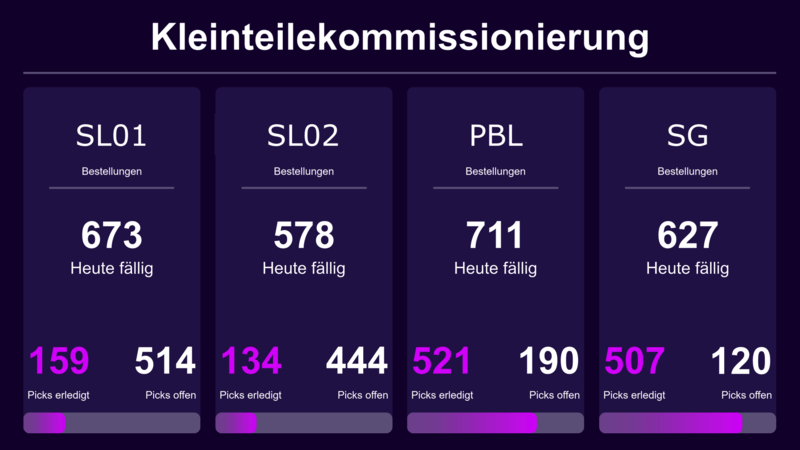
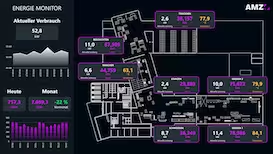
Visualize, understand, act — everything at a glance
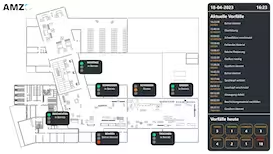
Peakboard brings structure to your data flows. Whether it's an Andon Board, BDE evaluation or shift monitoring — you design interactive dashboards that show live what counts: cycle times, system status, OEE, availabilities, shift goals or alarms.
The communication is bidirectional: You can not only read data, but also write it back — directly into your machine logic via Peakboard.
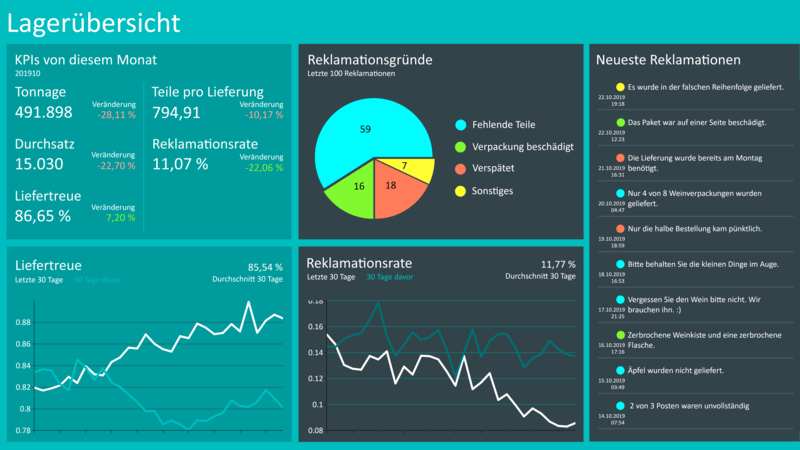
From real time to history — use data cleverly
The combination of Kepware & Peakboard not only provides operational transparency. About the Kepware OPC UA Server Can also Archiving long-term data — for example, in an SQL database. This creates the perfect bridge to BI tools such as Power BI or Tableau. This is how you analyze cycle times, scrap rates and production figures over weeks, months or years.
Flexible, scalable, future-proof
Kepware impresses with its modular architecture: You can bundle multiple protocols (such as Modbus, Ethernet/IP, Profinet) into a single server — with load distribution across multiple server instances. Peakboard complements this setup with a Low-code platform, which fits seamlessly into your infrastructure — and ensures maximum impact on displays, info boards, or touch panels.
How it works — data flow simply explained

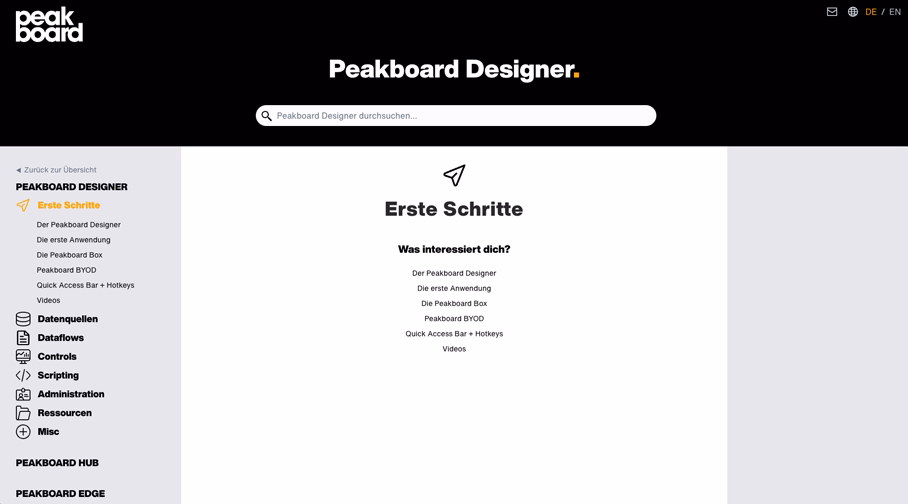
Start now for free with Peakboard Designer
Capture, process and visualize production and order data in real time — simply and without programming knowledge.


All of your data.
Peakboard connects your systems and brings all data to one platform — for visualization, automation and individual applications.


%201.svg)


%201.svg)


More information
for your start with Peakboard.

Save time with our templates
No time for long designs? No problem: Use one of the many ready-made templates for dashboards and applications — e.g. for production monitoring, warehouse management or quality assurance. Pick a template, customize it, and you're done.