Energy efficiency monitoring: More sustainability and lower costs
Energy efficiency monitoring makes the energy consumption of your production visible in real time – down to machine and line level. With Peakboard, you spot anomalies instantly, derive targeted measures and cut costs – for greater sustainability, with no programming required.


Reduce energy costs in real time — sustainably, reliably, intelligently
Find out where you're losing energy, how Peakboard counteracts this and what measurable benefits your company gets from it.
Challenge
- Undiscovered load peaks and inefficient processes increase costs.
- A lack of real-time data makes rapid countermeasures difficult.
- A lack of transparency leads to high resource consumption.
Solution with Peakboard
- Real-time monitoring of energy figures directly on the shop floor.
- Automatic alerts in case of discrepancies and exceedances.
- Intuitive dashboards for flexible analyses and well-founded decisions.
Result
- Lower energy costs through targeted process optimization.
- Improved sustainability and increased competitiveness.
- Permanent increase in efficiency thanks to historical trend analyses.
Fully adaptable to your needs
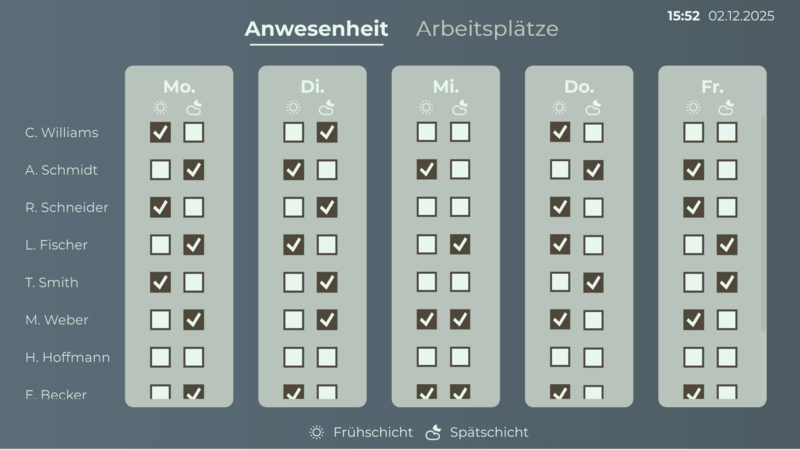
Shop Floor Management
As flexible as your processes.
With Peakboard, you create a centralized and flexible solution for your daily shop floor communication – perfectly tailored to your individual workflows.

- Standardised SQDC reports for a quick overview of the regular meeting
- Define your own key figures – manually or automatically
- Capture, edit, and track measures — structured and team-oriented
- Assign responsibilities with notifications via email, MS Teams, or Slack
- Adjust menu structure and content to fit your department’s needs
- Store historical data and analyze it with Power BI, QlikView, or Tableau
Discover how flexible shop floor management can be with Peakboard
All of your data.
One platform.
Peakboard connects your systems and brings all data to one platform — for visualization, automation and individual applications.


%201.svg)


%201.svg)


How to bring transparency and speed to your processes in 30 days
Implementing new software shouldn't take a year.
Get started for free with Peakboard Designer
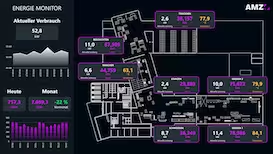
Create your energy efficiency monitoring dashboard to monitor your energy consumption in real time and react quickly to discrepancies. With our template, you can visualize all relevant data and get clear insights into optimization potential — without any programming knowledge.


High electricity costs and stricter environmental guidelines are increasing pressure on companies to make their production processes more efficient. In addition to immediate cost savings, consistent Energy efficiency monitoringto reduce the environmental footprint and ensure competitiveness. Whether in the process industry, mechanical engineering or food production — only those who know where an unnecessary amount of energy is being consumed can take targeted countermeasures. One data-based analysis offers the clear advantage here that optimization potential is objectively comprehensible.
This is how energy efficiency monitoring works with Peakboard
Data collection & integration
Peakboard connects a wide variety of sources — from industrial controls (Siemens S7, Beckhoff, Mitsubishi Electric) to IoT protocols (OPC UA, MQTT) to cloud services (Azure IoT Hub). This creates a complete picture of your energy consumption.
Configuration & visualization
In Peakboard Designer, you can use a low-code interface to design individual dashboards, define key figures and adapt layouts to your corporate design. All energy consumption data is presented clearly — in real time and regardless of location.
Alarm functions & write-back
Set automatic alerts that immediately trigger a notification when load peaks increase. Employees can react and initiate measures directly on the touch display or tablet. At the same time, all changes in the source systems are updated.
Evaluation & Peakboard Hub
To identify trends and better plan maintenance cycles, the Peakboard Hub stores your energy data permanently and securely.
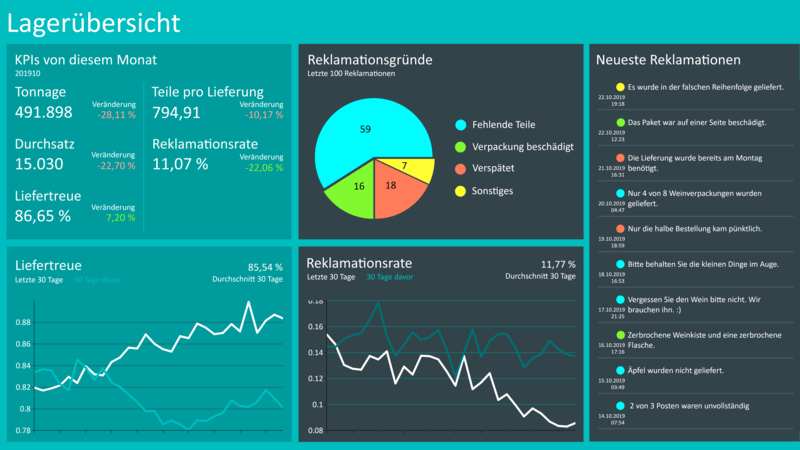
The most important features of energy efficiency monitoring
- Live consumption data
View current electricity, gas or heat consumption directly on interactive dashboards. - Peak load analysis
Set limits for the maximum load and be automatically warned when they are exceeded. - Calculation of energy costs
Link metrics with price information to determine on a daily basis how high your running costs are per production shift or per product batch. - Detailed history
Store energy figures in the Peakboard Hub and analyze them over longer periods of time. - Interactive dashboards
Employees can operate with touch screens or tablets, adjust load values or enter shift consumption.
Benefits of energy efficiency monitoring with Peakboard
- Holistic overview: All energy consumption data in one place
- Proactive fault detection: Early warning system for unusual load peaks
- Transparent communication: Employees immediately recognize where energy can be saved
- Easy scalability: Suitable for individual plants as well as for international production networks
- Long-term cost reduction: Through targeted process optimization and reduced downtime
Used by industry experts
to cleverly simplify processes.


“At first glance, the complete digitization of our processes appeared to us as a mammoth task. However, we quickly realized that this change was a decisive step towards operational excellence. ”
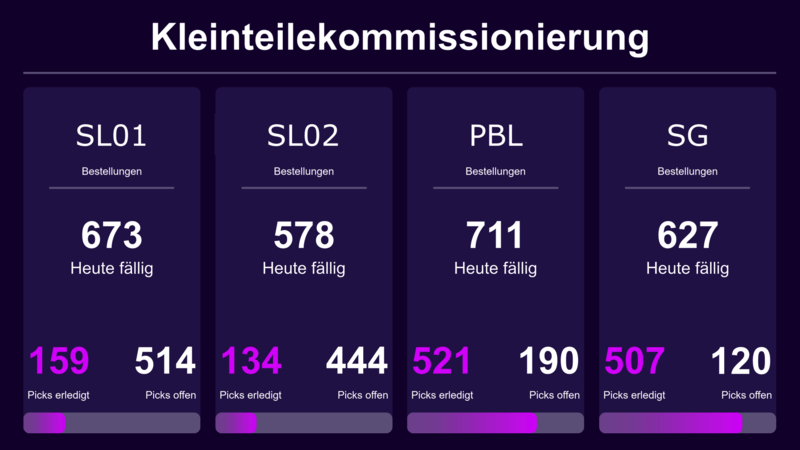
Save time with our templates
No time for long designs? No problem: Use one of the many ready-made templates for dashboards and applications — e.g. for production monitoring, warehouse management or quality assurance. Pick a template, customize it, and you're done.