Data connection with
MPDV
- Easily visualise and use real-time data from MPDV MIP
- Create individual mApps & HMI surfaces using low-code
- Peakboard as a flexible extension directly in your own department
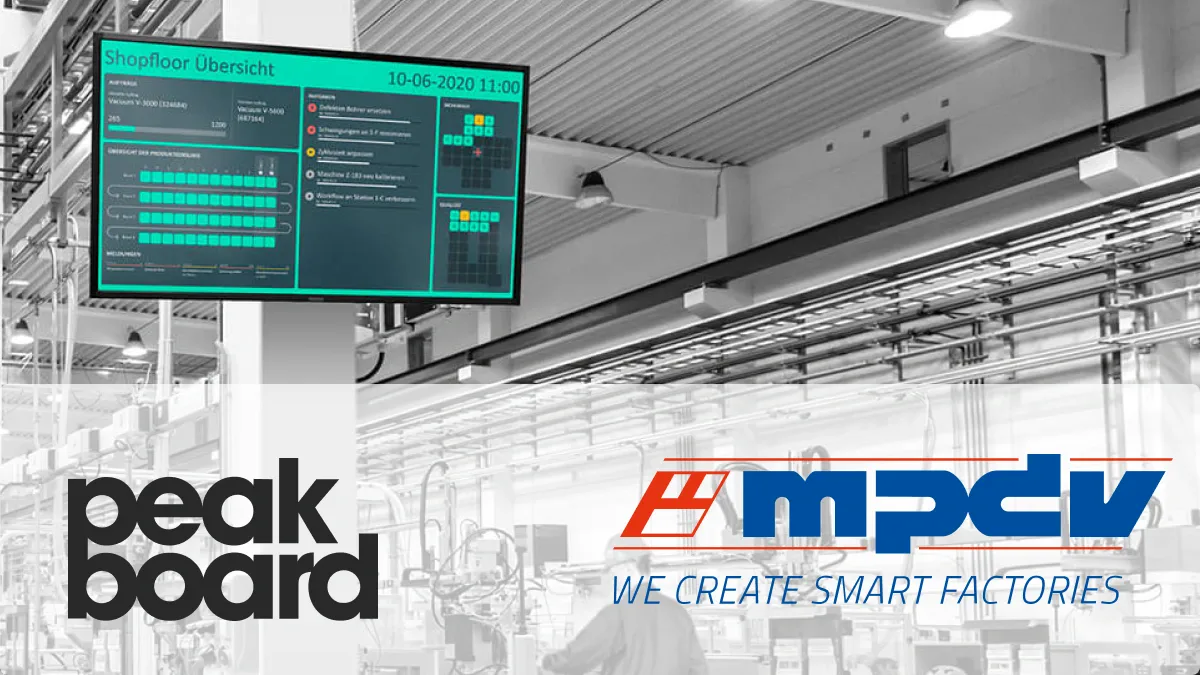



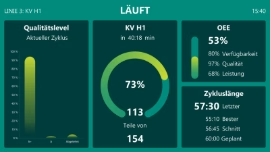


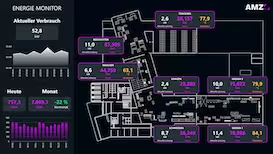
Interactive dashboards & mApps directly for MPDV MIP
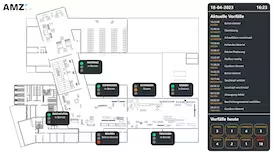
Through direct integration with the Manufacturing Integration Platform (MIP) from MPDV, Peakboard becomes the ideal front end for production data. You access and display MIP data in real time on interactive dashboards — exactly where they are needed: on the shop floor, in worker guidance or in the control centre.
Peakboard is more than just a visualisation tool: You can actively work with the data, e.g. use HMI functions to provide feedback, make inputs or control processes interactively — without complex IT projects.
Low-code for more independence in your department
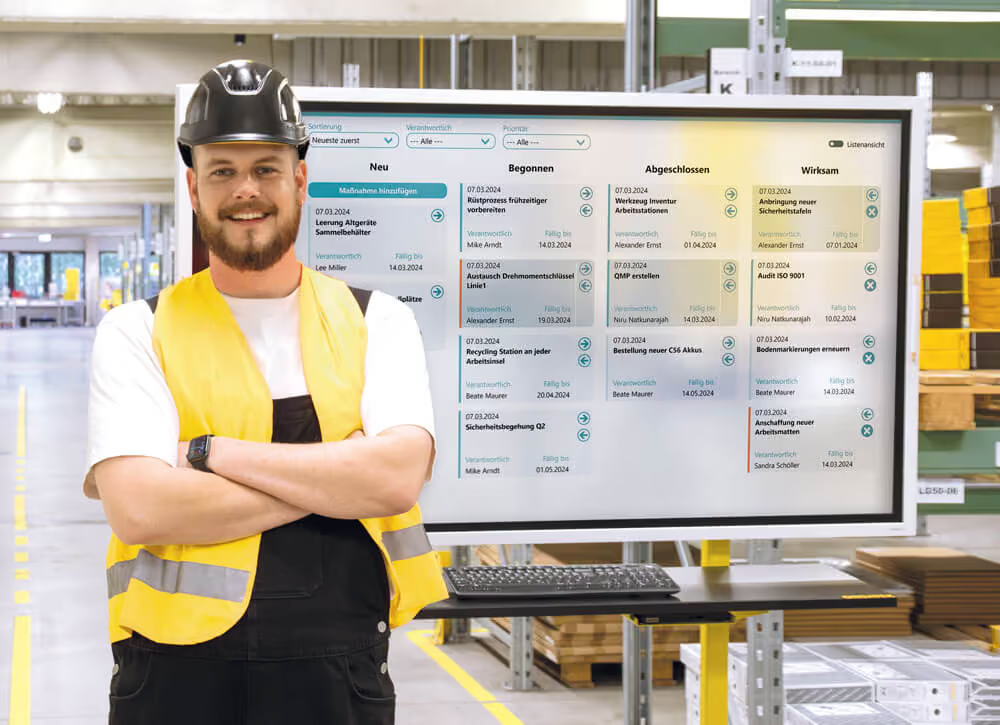
With Peakboard, you create your own applications — so-called mApps — directly in your own department, without relying on developer resources. Whether it's Andon boards, production data displays, shift management or visual feedback: The interface is intuitive, flexible and tailored to your requirements.
Thanks to low-code, functions such as filters, logics, interactions, and data links are easy to configure. This creates individual apps for the shop floor that really support processes — and not just display them.
Connect data diversity — everything at a glance
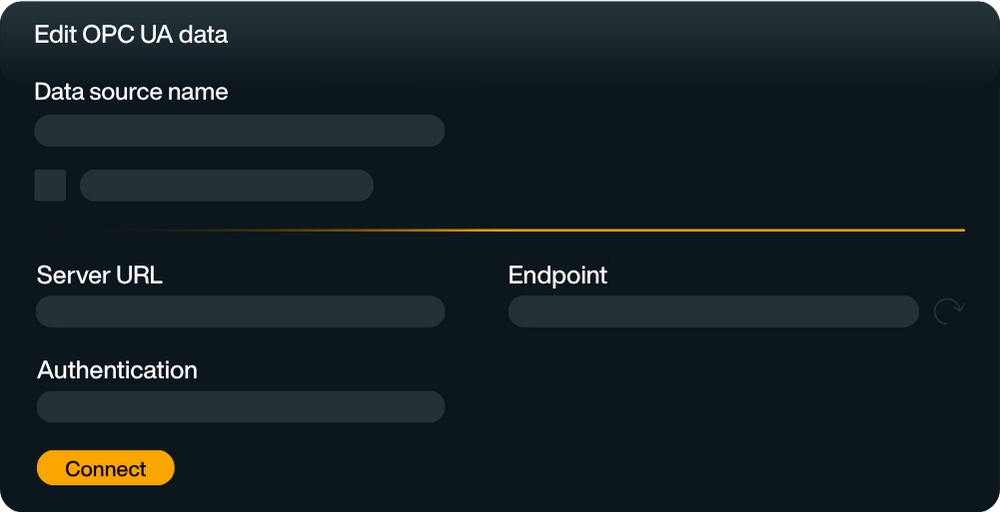
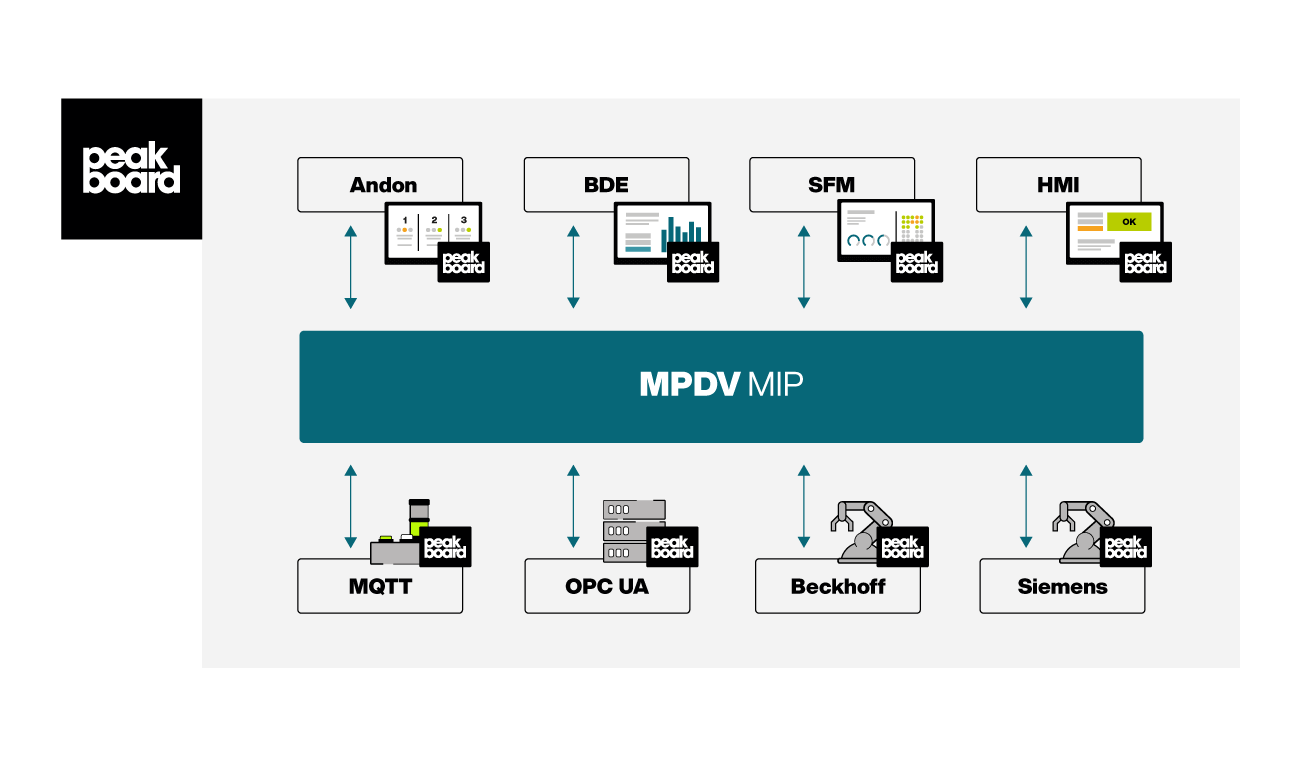
The strength of MIP lies in its openness — and Peakboard makes full use of this: You can combine MPDV data with other sources, such as:
- OPC UA-enabled controllers (e.g. Siemens, Beckhoff)
- MQTT sensors
- SAP, MES, or SQL databases
The result: One central, visual platform, which creates context and links all important data together.
That's what it looks like — data flow between MPDV & Peakboard
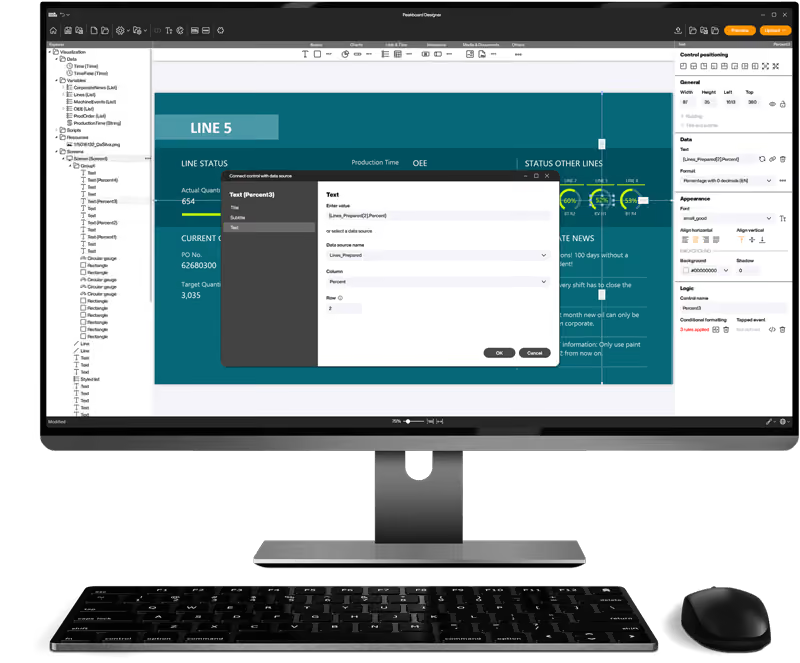
Start now for free with Peakboard Designer
Capture, process and visualize production and order data in real time — simply and without programming knowledge.

All of your data.
Peakboard connects your systems and brings all data to one platform — for visualization, automation and individual applications.


%201.svg)


%201.svg)


Save time with our templates
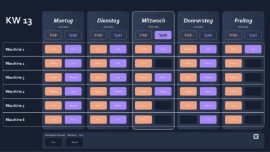
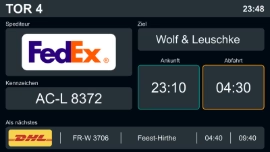
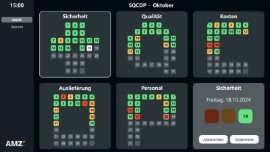
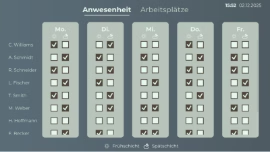
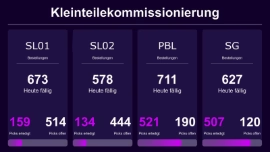
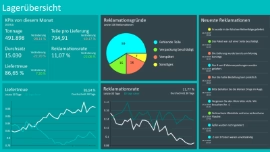
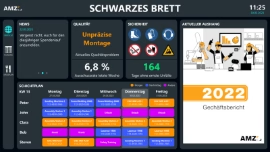
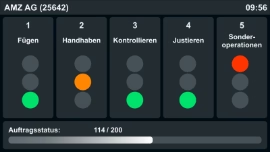
No time for long designs? No problem: Use one of the many ready-made templates for dashboards and applications — e.g. for production monitoring, warehouse management or quality assurance. Pick a template, customize it, and you're done.
More information
for your start with Peakboard.