
From magnetic board to real-time dashboard

Pankl Racing Systems AG
challenges
Digital real-time image of production despite large amounts of data
solution
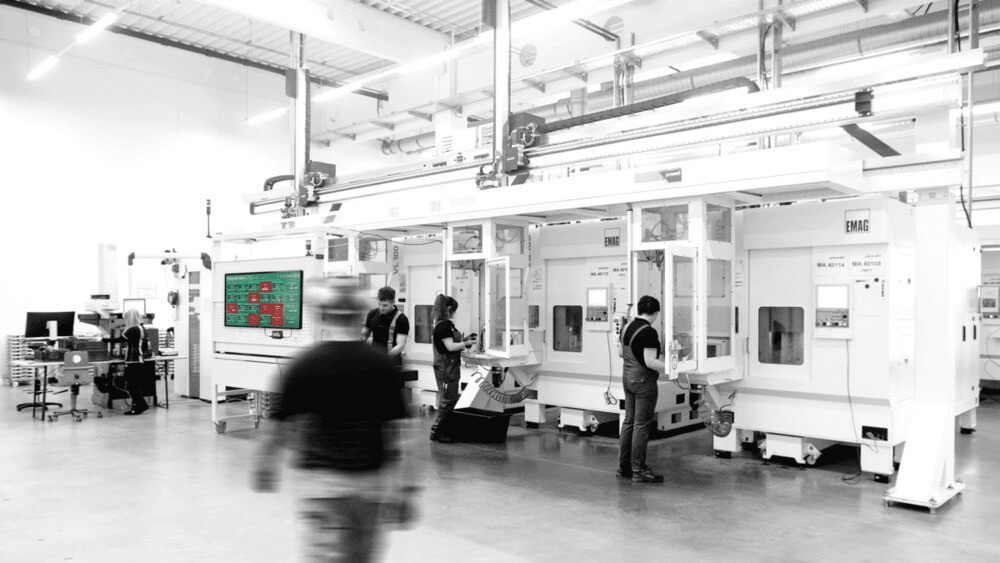
Central display of current production data on a Peakboard Andon Board
benefits
- Improved planning and logistics
- Real-time display allows targeted root cause analyses in case of problems
- Overview of current orders and target specifications, current quantity, percentage progress, machine status and reasons for machine downtimes
Time to Value
A few days until the real-time dashboard
Founded in 1985, Pankl Racing Systems AG is a leading international manufacturer of high-tech mechanical systems for dynamic components in the global niche markets of the racing, luxury automotive and aviation industries. At seven locations worldwide, 2,200 employees serve customers such as Ferrari, Porsche, McLaren and Airbus.
“We needed a central presentation of current production data on an Andon board to take the next big step towards operational excellence. Employees should be able to see the status of their system in real time: What is running on my machine here and now? The solution to be selected should also be able to become the standard in our Group so as not to work with a large number of different systems. ”
Yesterday was complicated
In production, there is a magnetic board with printed lists, in which employees manually record the production progress every two hours. At the end of the shift, this list is transferred to production planning and in excel transferred. Only shift and production managers receive a visual presentation of the data. An analysis of causes of delays It takes place afterwards and therefore late and is not always accurate. In addition, this system is complex and prone to errors.
In the course of the decision-making process, it becomes apparent that the solution should also have MES properties. “The systems used in the company so far were not flexible enough and did not allow any interactive inputs. As a result, the data was not up to date, we were unable to plan agilely and the employees working shifts had no knowledge of the current state of production at the end of the shift,” explains Jordan Marlin, Manager Operational Technology, Industry 4.0 Engineering at BWI.
Flexible and agile
The company strives for the lowest possible personnel and financial costs for data connection and visualization. Other criteria include flexibility and independence from the partner.
“It should be easy and quick to implement and easy to adapt in-house without using up IT resources,” summarizes Pichler.
The team is testing several offerings that prove too complicated and require extensive training.
“With Peakboard, on the other hand, I was able to download Peakboard Designer for free and test everything immediately; I wasn't dependent on statements from sellers or product demos. The templates available then showed very clearly what is possible,” says Pichler. “Right down to scripting, I understood how tasks were solved, even though I'm not a programmer by nature. Where I needed specific support, the support was very helpful, even before we became a customer. ”

From ERP via an SQL database to the dashboard
Pankl starts by producing the database through its business application team and creating a SQL database to program so that you do not have to access the ERP directly. This is the preferred solution for IT, as it can now import the data into a separate system and is no longer involved even from this point on. The amount of data to be processed comprises around 15,000 lines, which the company reduces in advance. Pichler designs more than half of the dashboard himself, and Pankl conducts a workshop with Peakboard for the rest.
There are currently a total of six at two locations Peakboard boxes And four times Peakboard Edge installed, digitally map 20 production lines and processes and also allow information to be fed in that is not yet available digitally. Employees see the current order and its Target, the current quantity, the percentage progress, the Machine status and also the reasons for Machine downtimes, which access the dashboard via an interactive input mask in the ERP. The displays are mounted centrally elevated in the respective production phase and update the data every ten minutes, which employees can also access from their home office. A main screen provides an overview, and three sub-screens supplement the information with important details.
The supervisors and plant managers are immediately impressed by the system.
“We were so excited about the options that we had 25 visualizations flipped through one screen one after the other. Peakboard had advised us against it, but we wanted to try it out,” says Pichler, describing the first steps. “It was overloaded. Our people had to wait a long time before they could see their machine. Now we have a visualization that shows the status quo of the most important parameters immediately and as large as possible. ”
This meets the needs of shift managers, who can now recognize the information they need at a glance even remotely.
“If we had made this mistake with a classic solution, it would have been a cost-intensive process. Now, after half a day of adjustment in-house, the problem was resolved without having to use IT. ”
More agile processes through complete transparency
Pankl employees have known down to the minutewhether they're on- or off-track. If a line breaks, they can immediately intervene. Before finding a solution, an employee had to write off the downtime of a machine by hand for approximately 15 minutes and pass it on. In addition, planning and logistics have improved significantly and the Real time display allows targeted Root cause analyses.
“Shift managers can react more quickly to deviations. With 20 plants and 10,000 m² of production space, the overview was lost. Now you can see the entire production on the main screen at a glance. Technical managers, plant managers and planning can access the data via Peakboard Hub and also have insight into current production progress. Our shift report is automatically created based on the data and distributed by email. Since we produce 24/7, this information is extremely important for managers,” Pichler draws a positive conclusion.
Pankl is therefore considering gradually expanding the system to other locations and subsidiaries in order to establish it as a group-wide standard solution.
Start now with Peakboard and simplify your processes
Turn live data into smart decisions with Peakboard.
