Store and Historise MQTT Data with Peakboard Hub Flows
With Peakboard Hub Flows, you can historise MQTT messages automatically: every new message gets a timestamp and is stored in a Hub list in Peakboard Hub.
04.11.2026
·
4 min read

- You can build Hub Flows as a Flow project in Peakboard Designer, and they run in Peakboard Hub.
- A Flow project has no screens and uses the same data sources, dataflows and functions as a Peakboard application.
- In a Flow project, data sources, dataflows and functions only run when a Hub Flow triggers them.
- The Hub Flow creates the Hub list for the results automatically.
The example shows the basics of Hub Flows using the temperature value of a Shelly sensor.
What Hub Flows are for
Peakboard applications usually run locally on a Peakboard Box or on your own Windows device (BYOD). Some tasks, however, are better handled centrally on a server. That is what Peakboard Hub Flows are for: you can build them in Peakboard Designer, and they run in Peakboard Hub. Before you start, you need to connect Peakboard Designer to a Peakboard Hub instance.
How Flow projects work

Starting with version 4, Peakboard Designer offers a project type called Flow project. A Flow project has no screens, because Hub Flows have no user interface. Otherwise, it works much like a regular project:
- You can use data sources and dataflows to retrieve and process data from connected systems.
- You can build complex logic in functions, written in Lua or with Building Blocks.
- You can use Hub Flows to control what happens and when. In a Flow project, data sources, dataflows and functions only run when a Hub Flow triggers them.
Results are stored in Hub lists, where you can save data and read it back. A Flow project comes with a built-in function that lets you write the output of data sources or dataflows directly to a Hub list.
Historise temperature values step by step
1. Create the MQTT data source
In Peakboard Designer, you can create a Flow project with “New Flow project” and add the MQTT data source MyTemperature. In it, you can subscribe to the MQTT topic the Shelly sensor uses to send the temperature, in this example MyShellyTemperature/status/temperature:0.

2. Add a timestamp with a dataflow
The timestamp comes from the project’s DateTime data source. Based on MyTemperature, you can create the dataflow MyTemperatureWithTS with two steps:
- With “Add column”, you can add the column TS with the data type String. Its value comes from DateTime in the format yyyy.MM.dd HH:mm:ss, for example 2025.06.21 17:01:01.
- With “Reorder columns”, you can sort the columns so that the timestamp comes before the temperature.

3. Build the Hub Flow
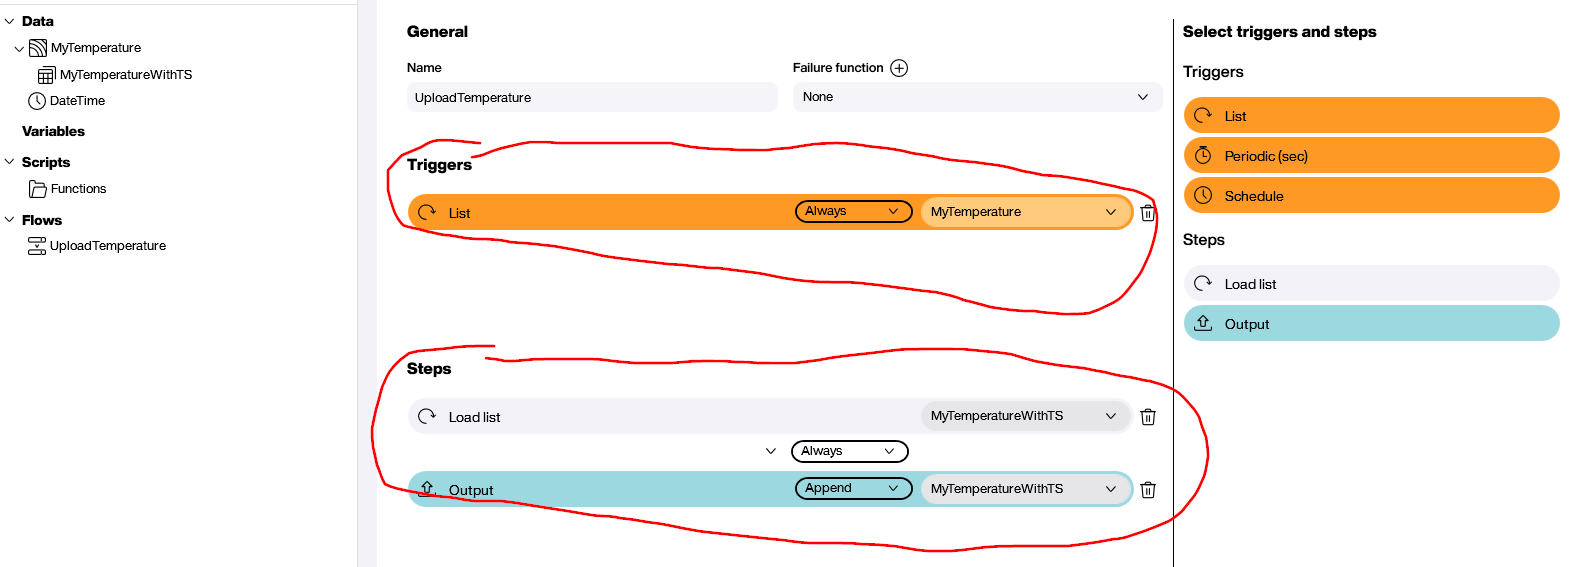
The Hub Flow UploadTemperature should run for every new MQTT message. So you can choose a “List” trigger with the data source MyTemperature, which responds to every refresh of its list. Two steps follow:
- Load the dataflow: With the “Load list” step, you can run the dataflow MyTemperatureWithTS. It returns the temperature and the timestamp.
- Store in a Hub list: With the “Output” step in “Append” mode, you can add the result to a Hub list, so every message becomes a new row. The Hub Flow creates and names the list automatically, based on the metadata.
4. Upload and monitor
With the “Upload” button, you can deploy and activate the Hub Flow in Peakboard Hub. In Peakboard Hub, you can see the result of the last execution and the log entries under “Hub Flows”. Green status icons show that the last MQTT message was processed successfully.

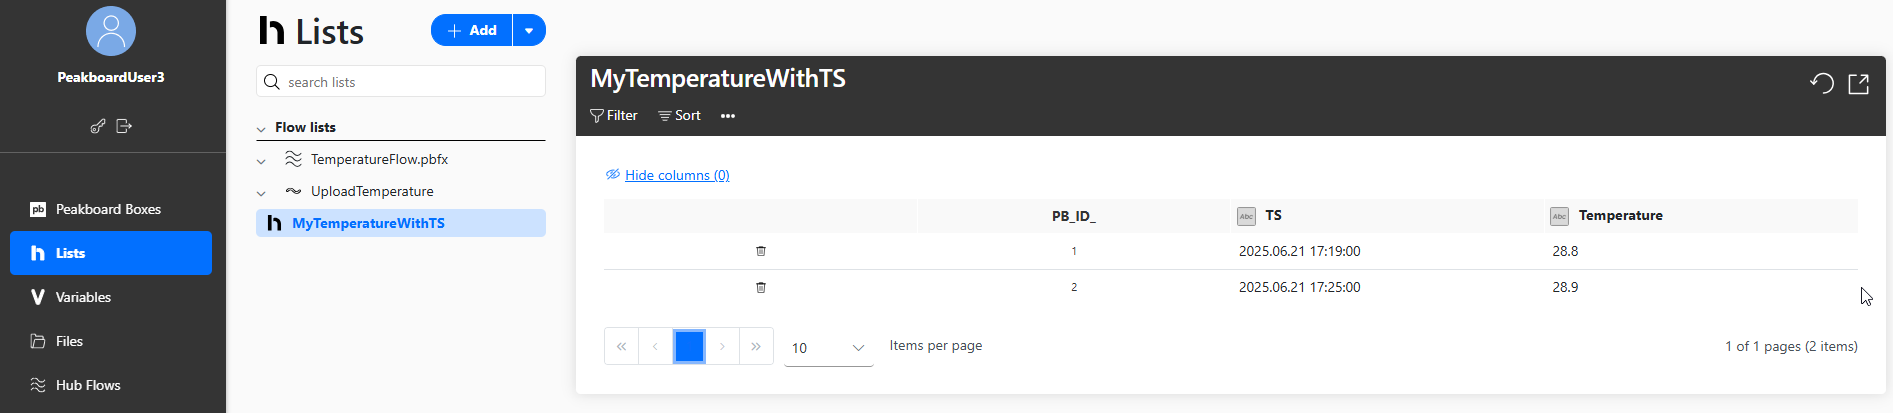
Under “Lists”, you will find the automatically created Hub list MyTemperatureWithTS with all temperature values received so far.
Further reading
You can download the Flow project TemperatureFlow.pbfx and open it in Peakboard Designer. The MQTT data connection page explains how to connect MQTT in Peakboard Designer. If you want to store machine states in your own SQL database, read the article on the data historian with Peakboard.
Free trial
Try Peakboard Hub for free
Hub Flows are included without limits in the 60-day Peakboard Hub trial, so you can rebuild the example from this article right away.

What is a Flow project?
A Flow project is a project type in Peakboard Designer version 4 and later. It has no screens and uses data sources, dataflows and functions like a Peakboard application. It runs as a Hub Flow in Peakboard Hub.
Do I have to create the Hub list first?
The Hub Flow creates and names the Hub list automatically when it stores the data, based on the metadata.
When does the Hub Flow run in the example?
The trigger is the refresh of the MQTT data source, so the Hub Flow runs for every new MQTT message from the sensor.
Where can I see whether the Hub Flow works?
In Peakboard Hub under “Hub Flows”. It shows the result of the last execution with a status for each step, along with the log entries.
Where do Peakboard Hub Flows store the MQTT data?
In a Hub list in Peakboard Hub. The “Output” step in “Append” mode adds each MQTT message to the list as a new row with a timestamp.