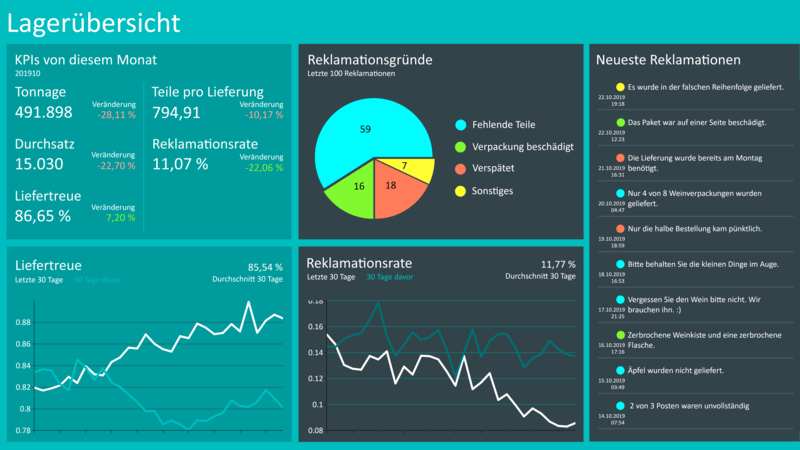
Conveyor Scale Monitoring – Track Your Material Flow in Real Time
Conveyor scale monitoring keeps throughput, belt speed and weights in view at all times. With Peakboard, you visualise your conveyor scale data clearly, spot trends and deviations instantly and make better decisions during operation – with no programming required.


Monitor material flow transparently and identify fluctuations early
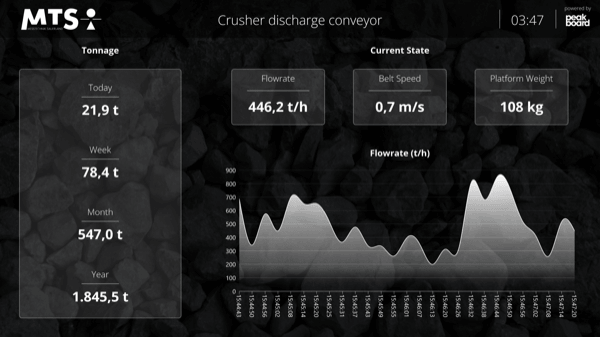
This template was created in collaboration with the belt scale manufacturer MTS and is based on practical requirements from industry. Always keep an eye on current flow rates and identify deviations directly during operation.
Challenge
- Delivery volumes are not visible in real time
- Fluctuations or faults are detected too late
- Historical data is difficult to access or unclear
- Decisions are often based on delayed or incomplete information
Solution with Peakboard
- Live visualization of flow rate, belt speed and weight
- Combination of real-time data and monthly overview for daily values
- Direct connection to belt scales via Modbus, OPC UA, MQTT or BACnet
- Central presentation of all relevant key figures in a dashboard
Result
- Transparent overview of the entire material flow
- Faster response to deviations and faults
- Better assessment of developments over time
- More informed decisions based on current and historical data
Fully adaptable to your needs
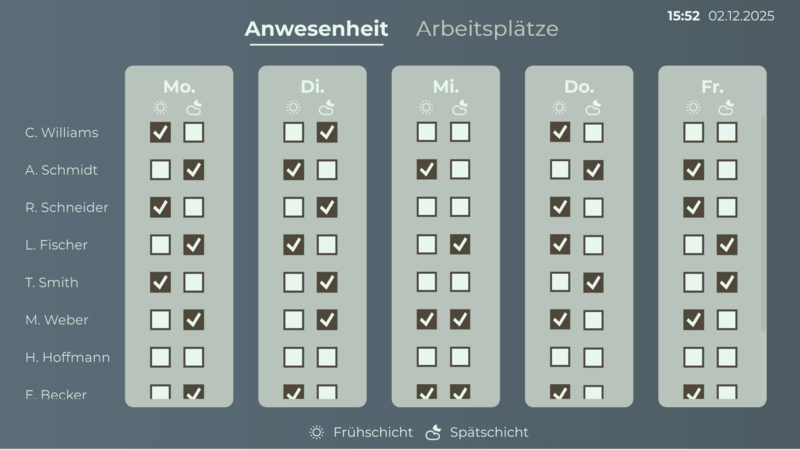
Shop Floor Management
As flexible as your processes.
With Peakboard, you create a centralized and flexible solution for your daily shop floor communication – perfectly tailored to your individual workflows.

- Standardised SQDC reports for a quick overview of the regular meeting
- Define your own key figures – manually or automatically
- Capture, edit, and track measures — structured and team-oriented
- Assign responsibilities with notifications via email, MS Teams, or Slack
- Adjust menu structure and content to fit your department’s needs
- Store historical data and analyze it with Power BI, QlikView, or Tableau
Discover how flexible shop floor management can be with Peakboard
All of your data.
One platform.
Peakboard connects your systems and brings all data to one platform — for visualization, automation and individual applications.


%201.svg)


%201.svg)


How to bring transparency and speed to your processes in 30 days
Implementing new software shouldn't take a year.
Get started for free with Peakboard Designer
Get full transparency about your processes in real time and clearly evaluate developments – immediately ready for use and without any programming effort.


This template combines live data with historical evaluations and makes funding processes immediately understandable.
Why is monitoring conveyor scales and material flow useful?
Monitoring conveyor scales creates transparency about ongoing conveyor processes and helps to identify deviations at an early stage.
- Real-time insight into flow rate and system performance
- Early detection of fluctuations, overloads or downtimes
- Continuous data basis for optimizations
- Better predictability of production and use of materials
What data and functions does the conveyor scale template offer?
The template bundles all relevant key figures and presents them clearly for operational use.
- Display of flow rate, belt speed and weight in real time
- Monthly overview with daily flow rates
- Visualizing trends and anomalies over time
- Use in the control room or directly on the system
How does the integration of conveyor scales with Peakboard work?
Peakboard connects directly to the belt scale and processes the data for visualization in real time.
- Connection via Modbus for direct reading of machine data
- Alternative interfaces such as OPC UA, MQTT or BACnet can be used
- Processing and updating data during operation
- Using variable lists for demo or offline scenarios
Why use Peakboard for conveyor scale monitoring?
With Peakboard, individual monitoring solutions can be quickly implemented and flexibly expanded.
- Build applications without programming
- Easy integration into existing machines and systems - over 100 interfaces available
- Adaptable to different systems and requirements
- Scalable from an individual conveyor belt to the entire system
Used by industry experts
to cleverly simplify processes.
Save time with our templates
No time for long designs? No problem: Use one of the many ready-made templates for dashboards and applications — e.g. for production monitoring, warehouse management or quality assurance. Pick a template, customize it, and you're done.