DISPLAYS ON SITE
1 Display
EMPLOYEES
18
Data sources


1 Licence
One licence per display

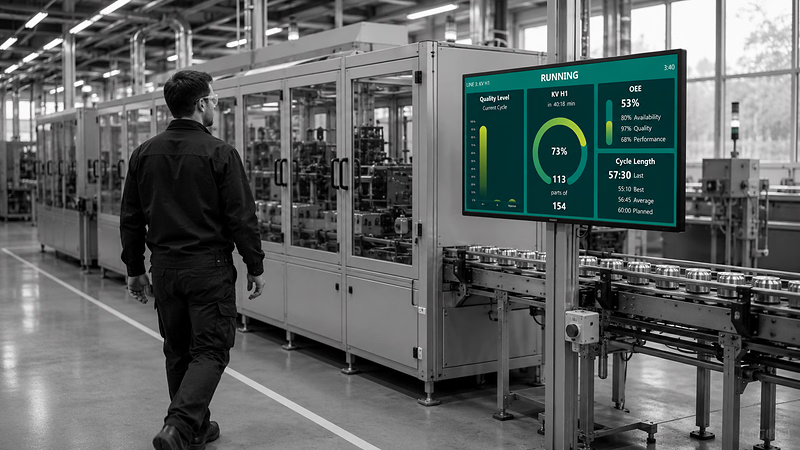
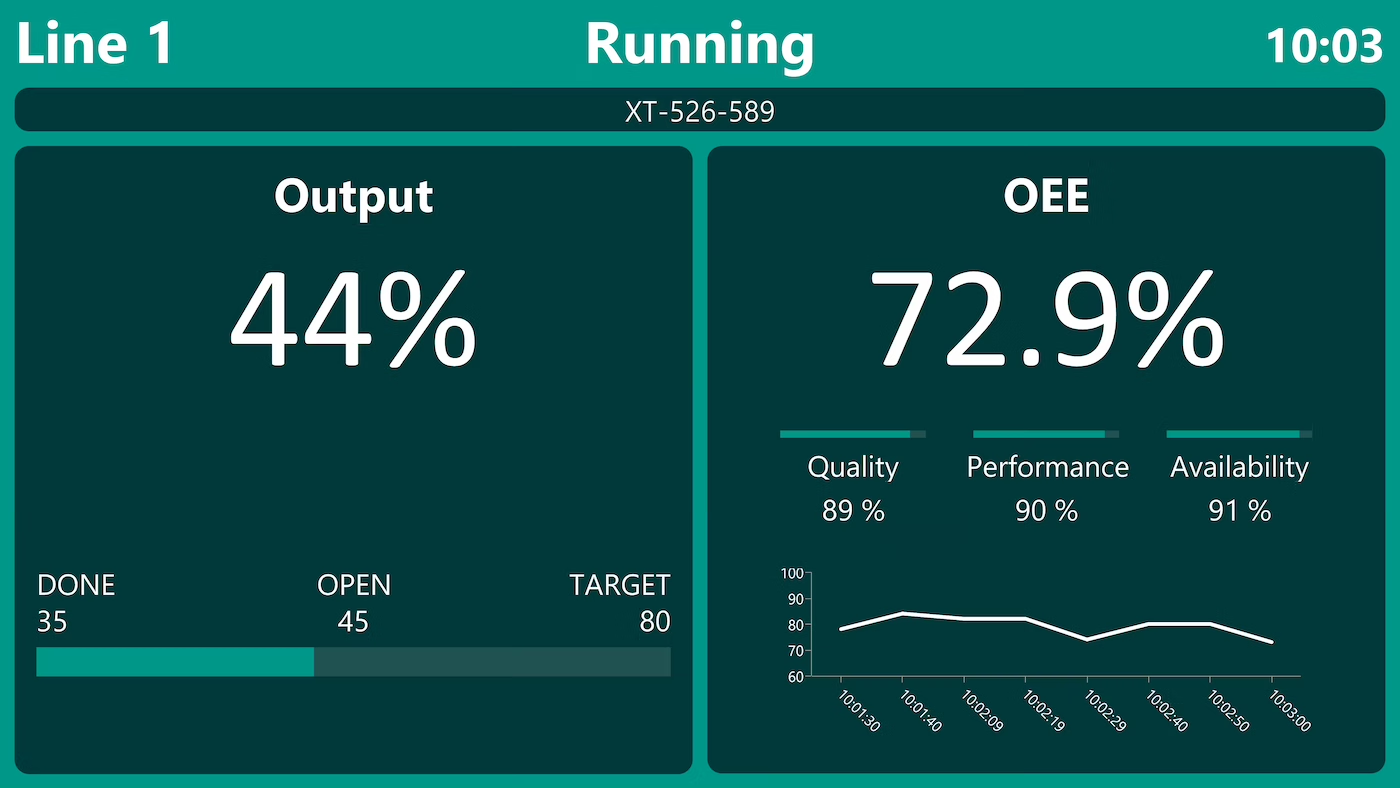
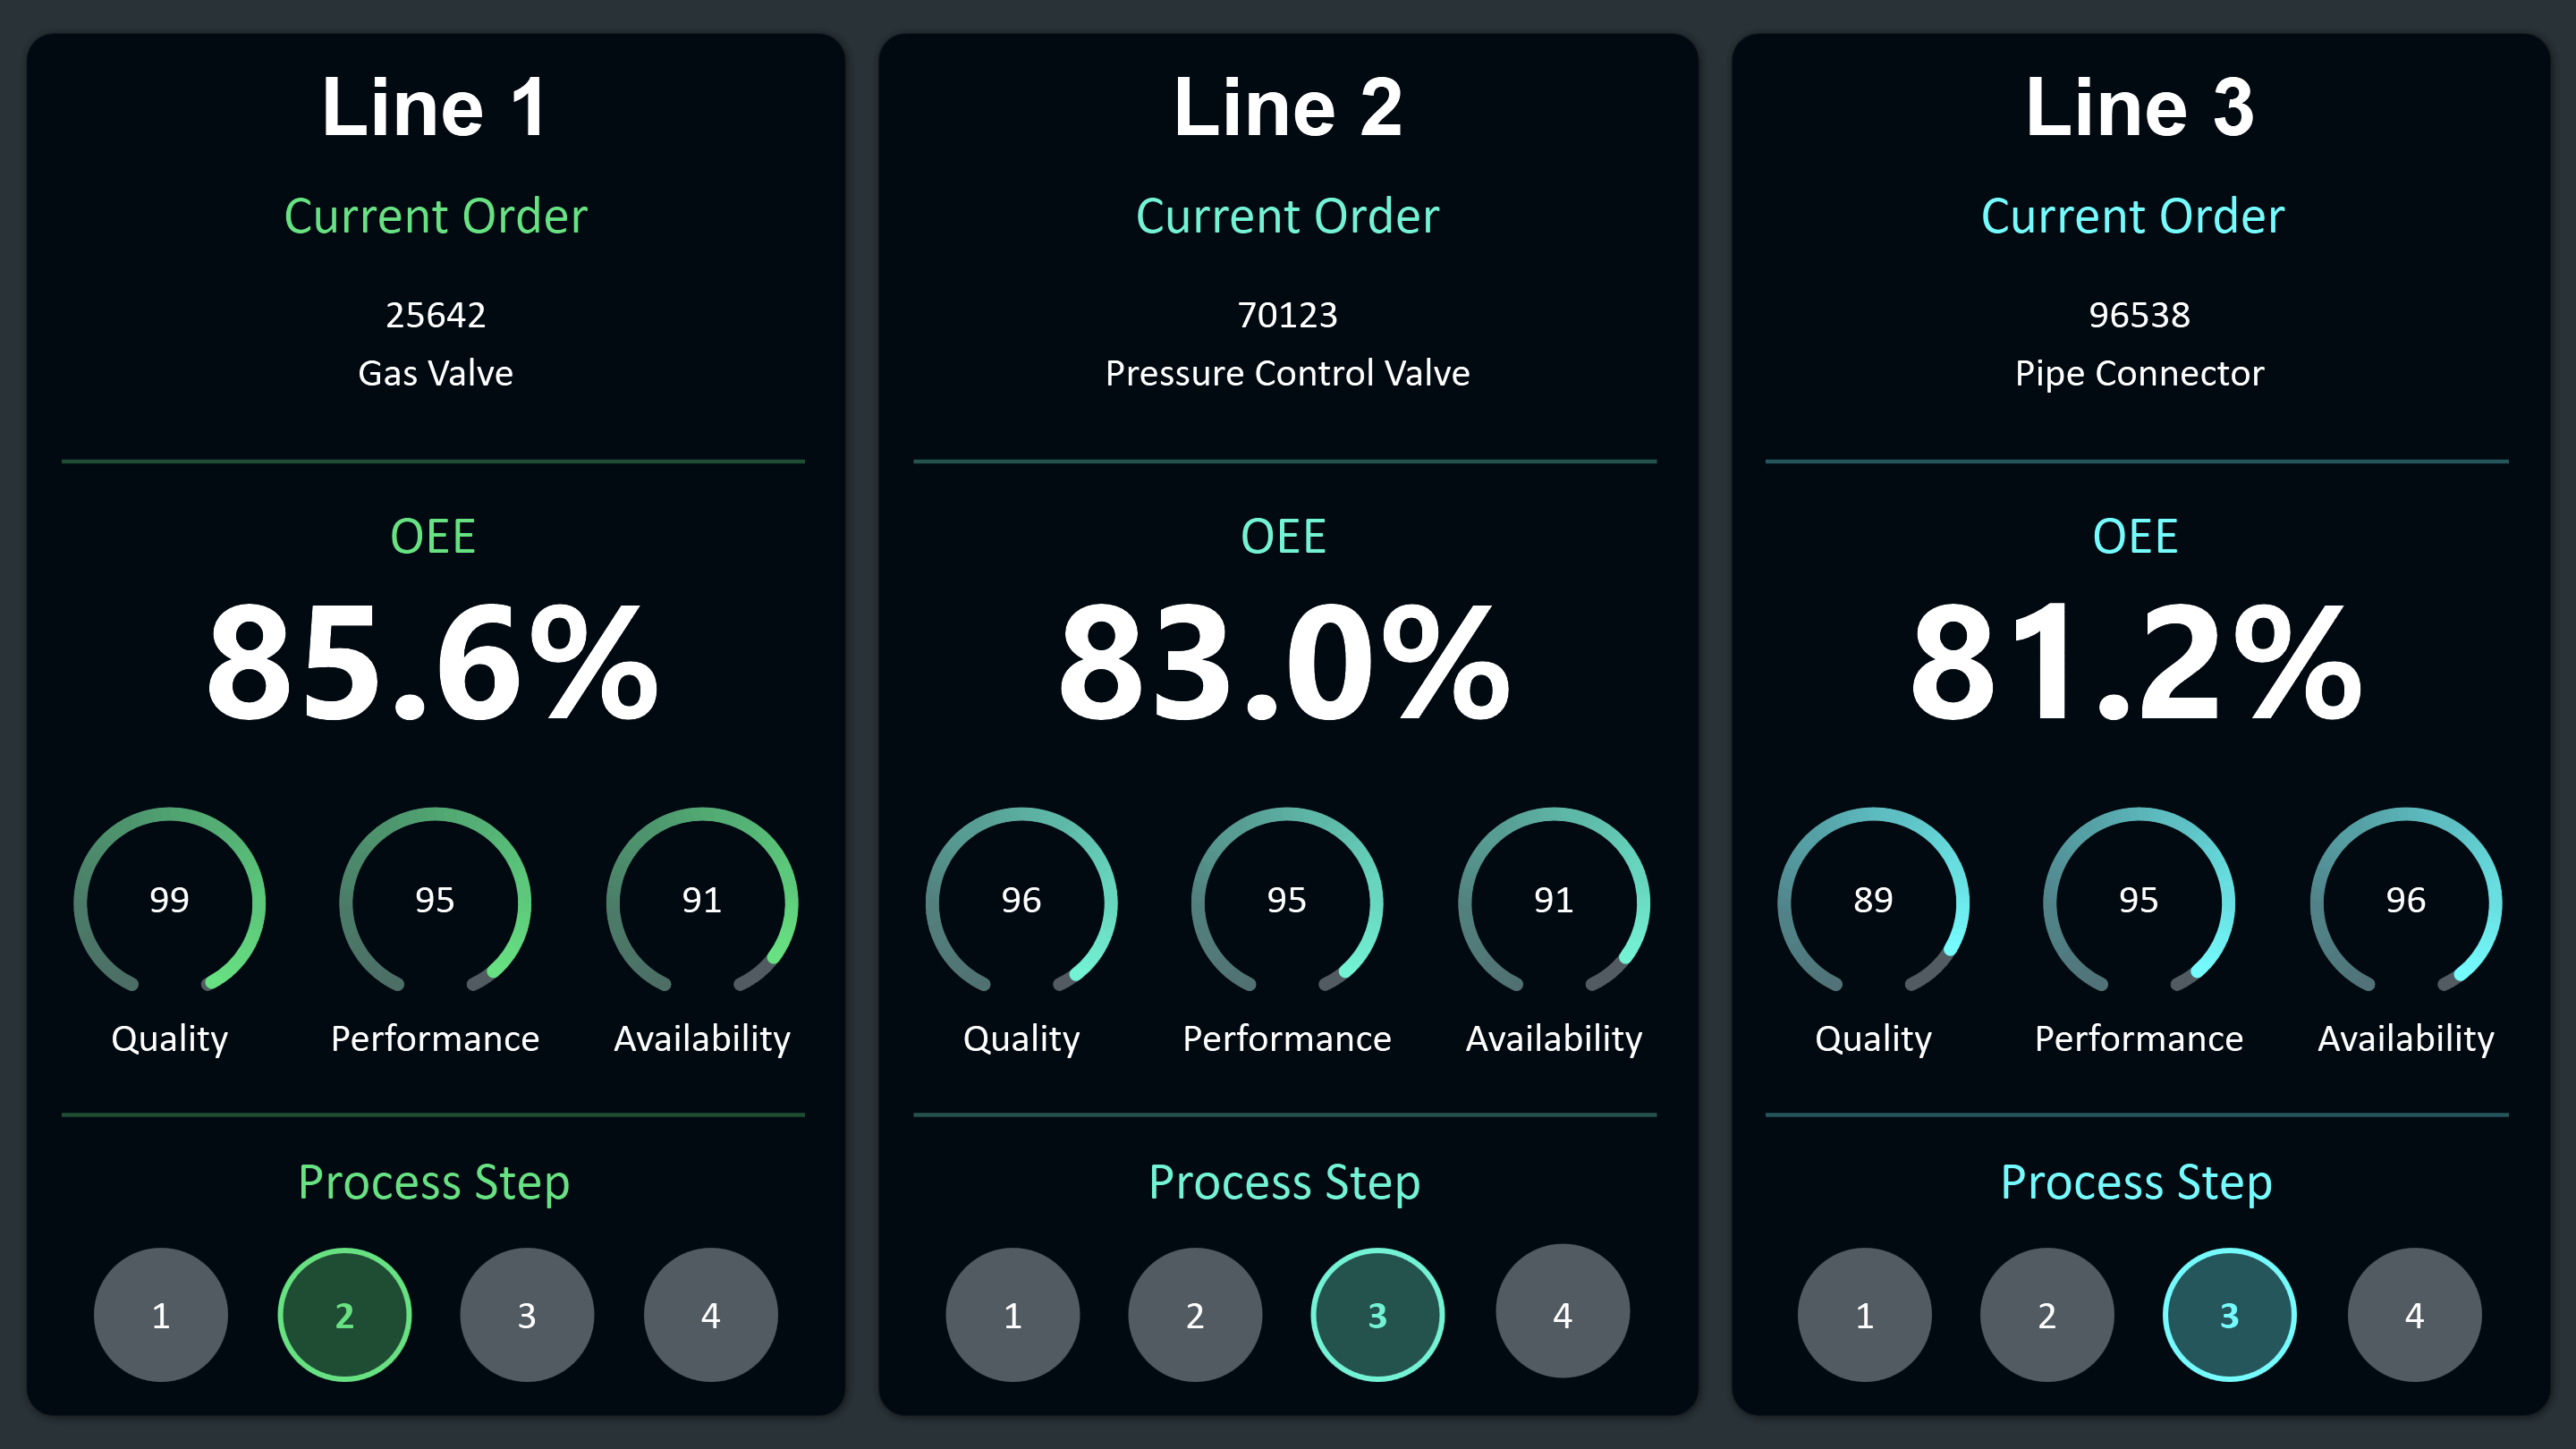
Cycle status and quality from Peakboard monitors a single production line: cycle time, the quality level of the running cycle and overall equipment effectiveness sit side by side. In the template, variable lists supply the values – for real use, the timer script and variables give way to your own machine connection.
.avif)


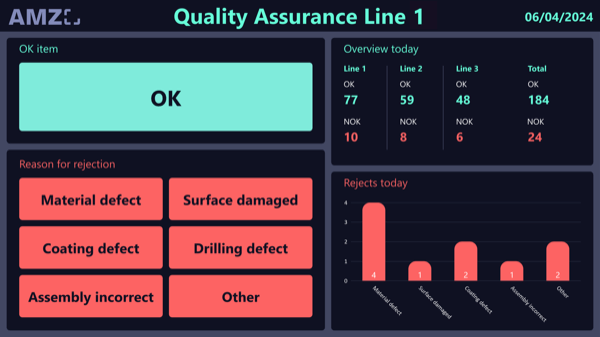
The quality level of the current cycle is not immediately visible.
How long a cycle really takes sits only in the controller.
The line's OEE only gets calculated afterwards.
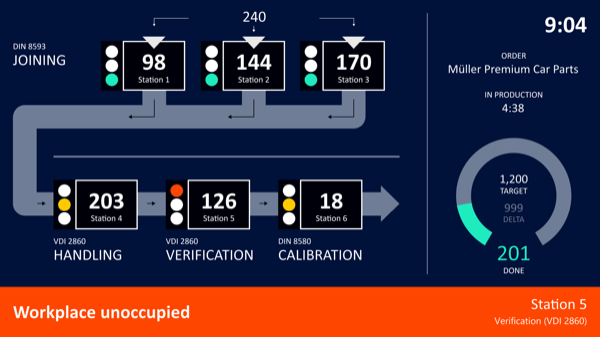
Native SAP connector, OPC UA, MQTT, and dozens of other sources are available out-of-the-box. You just connect, instead of integrating – and the data appears directly at the shop floor.


%201.svg)


%201.svg)


A different metric, a real data source instead of variables, an extra line – thanks to the low-code editor and Peakbot, you can adapt the dashboard yourself, no coding skills required.
Whether on the Peakboard Box or your own hardware – both run 100% on-prem, with no single point of failure or dependency on US providers.
Device-based pricing instead of user-based licences: one licence per display, unlimited users per device. More staff on the same display cost nothing extra.



Introducing this dashboard shouldn't be a project. With Peakboard, you get a first reading in minutes – no appointment, no major IT project.

Start Immediately · No Appointment · Free
If you need support: You'll find tutorials and step-by-step guides on our Helpsite and our YouTube channel. For individual needs, we offer workshops and consulting.
In conversation · With experts · 55 min.
Discuss your specific use case with an expert – briefly provide information about your use case beforehand, and we'll get straight to the point.
You'll get a complete overview of all features and see what's possible with Peakboard in your environment.

The template is an example setup: variable lists and a timer script supply the values so you can look at the dashboard straight away. For production use, they give way to your own machine connection. For more comprehensive line monitoring with multiple metrics and touchscreen operation, see our OEE Dashboard.
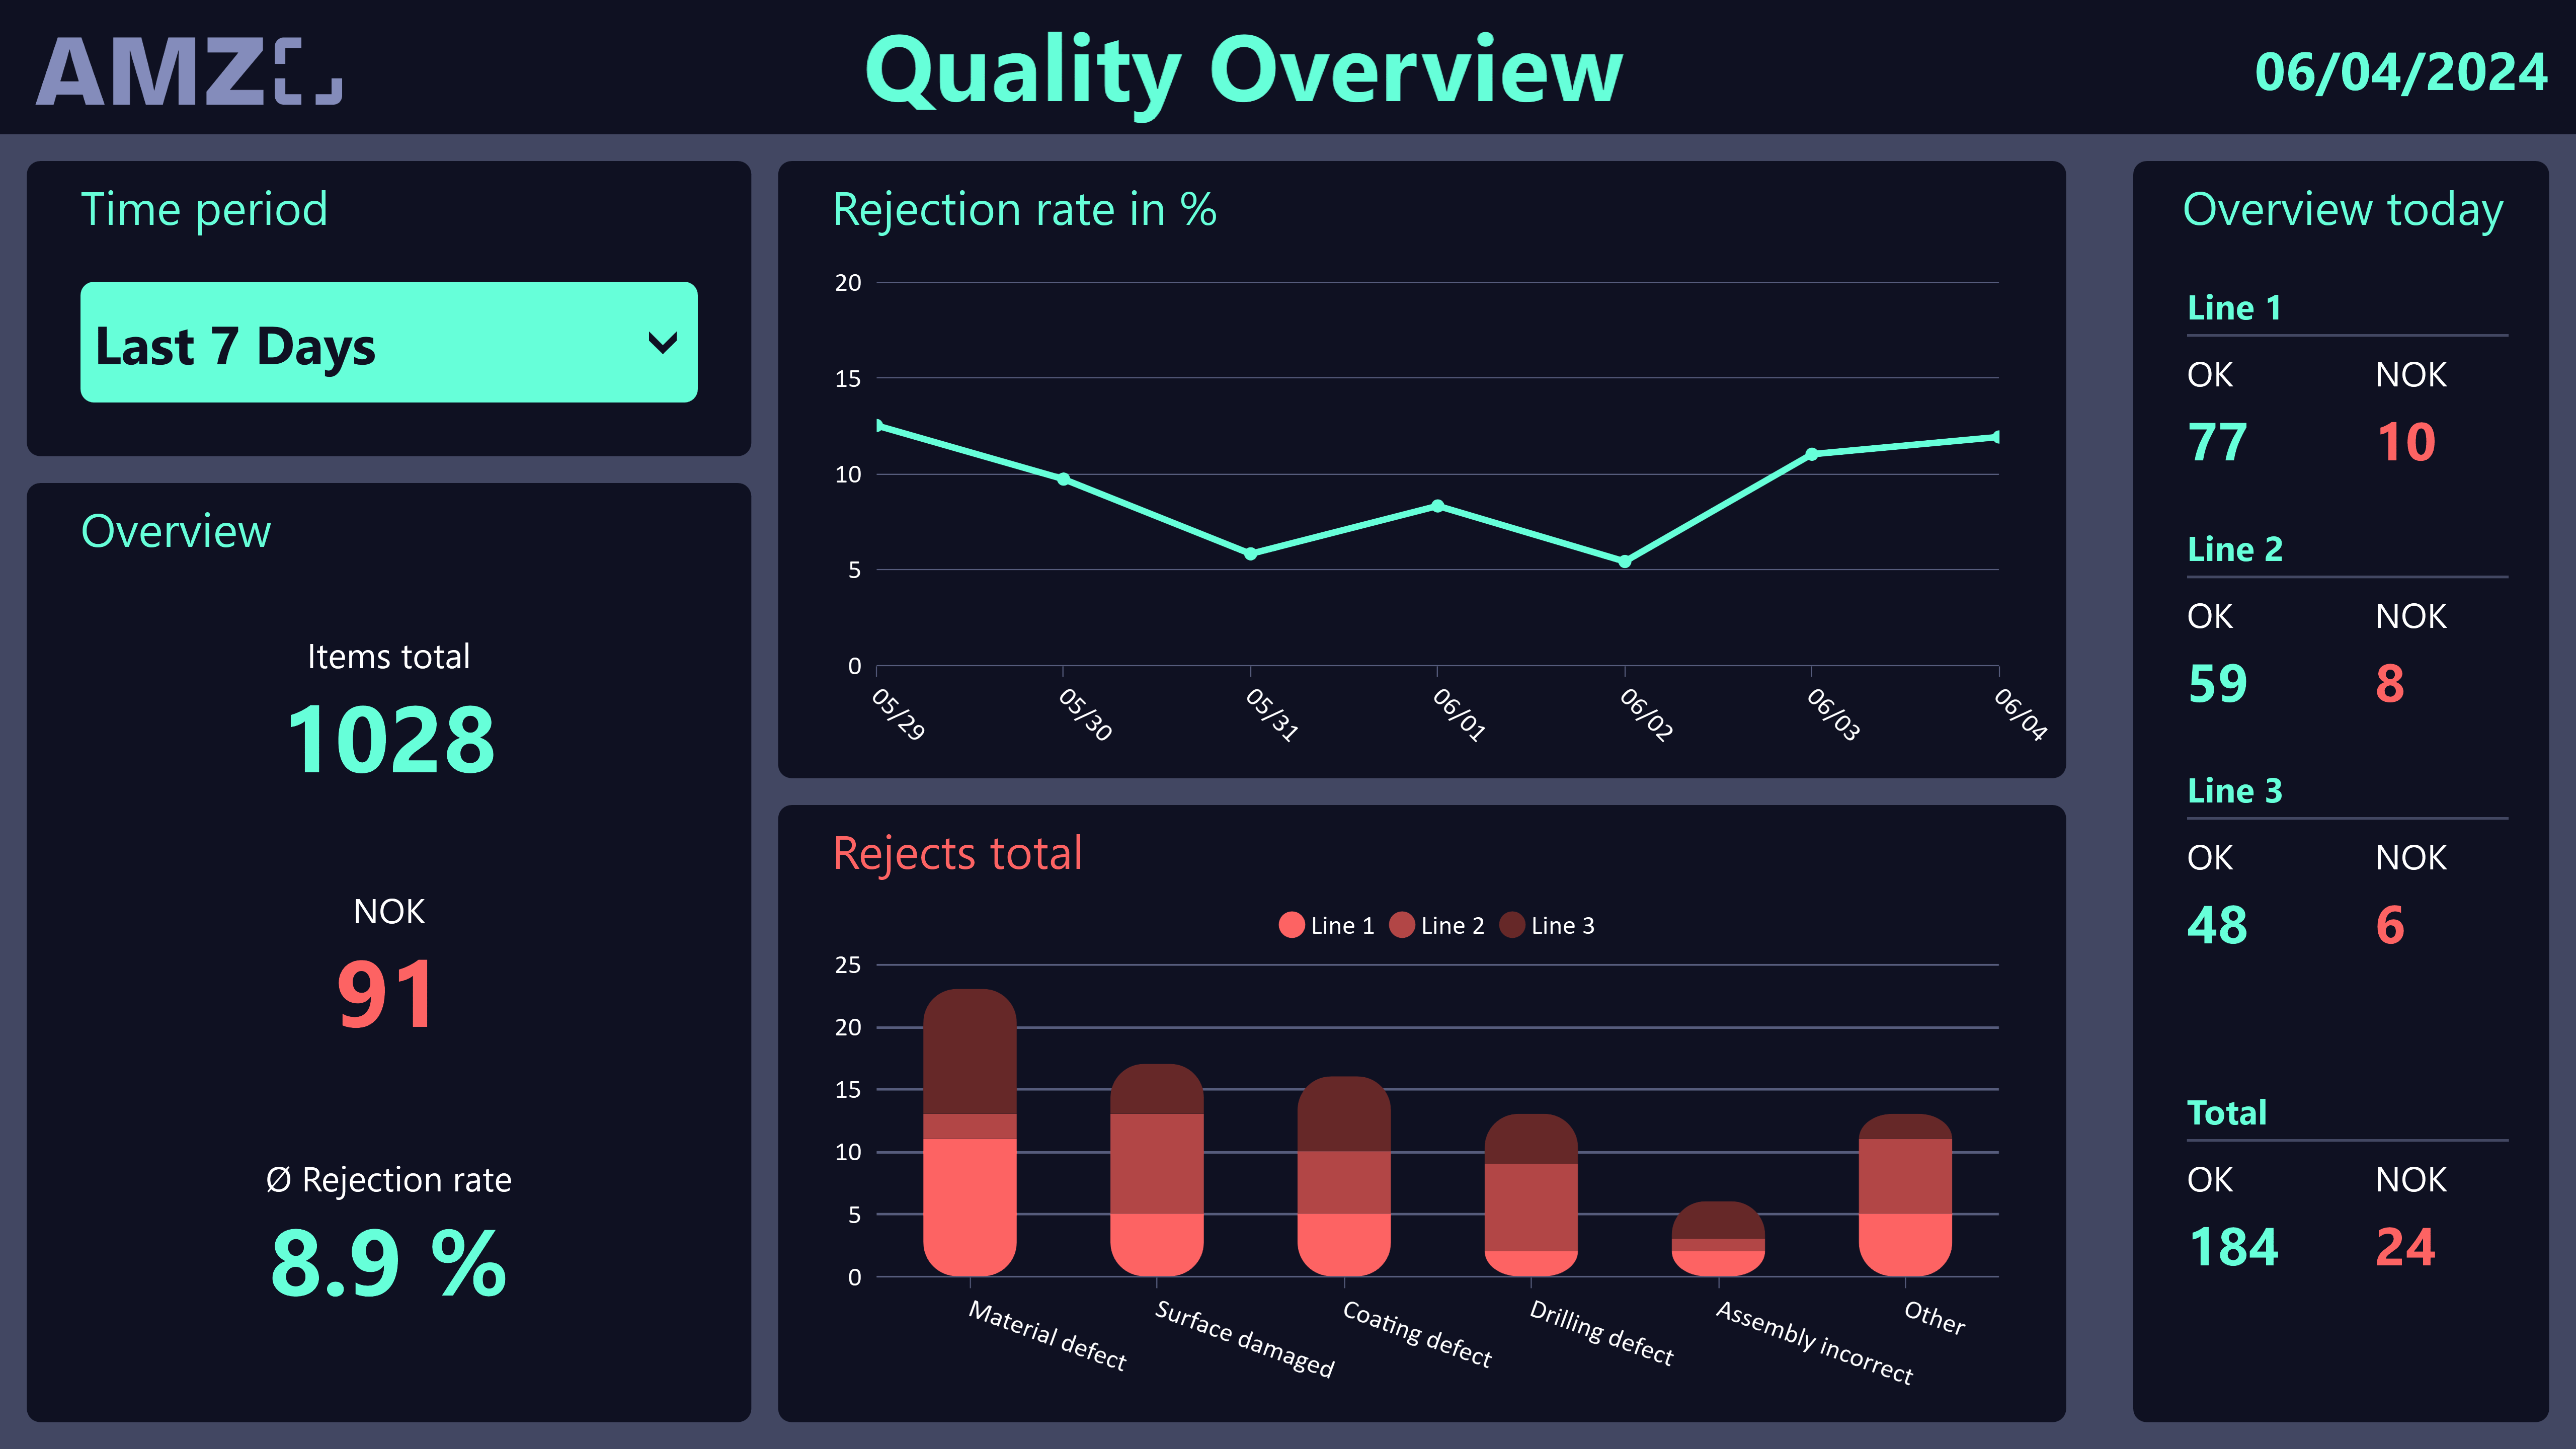
Cycle time and quality level are two of the three elements that make up OEE. OEE software adds availability and turns them into a single figure you can compare across shifts and lines.
The quality level of the current cycle, the cycle time and the Overall Equipment Effectiveness (OEE) of the production line – side by side on one screen.
In the template, variable lists and a timer script supply the values so you can try it straight away. For production use, you connect your own machine.
You replace the timer script and variables with your own values. Alternatively, you can connect real systems such as ERP (SAP, abas, proALPHA), MES, or machine interfaces like OPC UA, MQTT, or Siemens S7.
This dashboard is deliberately lightweight and shows three metrics for one line. For full line monitoring with multiple metrics and touchscreen operation, the more comprehensive OEE Dashboard is the better fit.
Yes. Peakboard is a low-code platform: you change layout, metrics, and data sources by drag-and-drop in the Peakboard Designer.
Peakboard runs entirely on-premises on your own network – production data never leaves the company. There's no cloud requirement and no dependency on US-based infrastructure providers – 100% GDPR-compliant.