
Peakboard Designer
Low-code editor for building your industrial applications.
Learn more
OEE software records run times, unit counts and scrap, calculates availability, performance and quality from them, and shows which loss is pulling the figure down. Peakboard takes the data from your controllers and ERP and puts it on the display at the line – and where the operator should add the reason straight away, they tap it in on the screen.









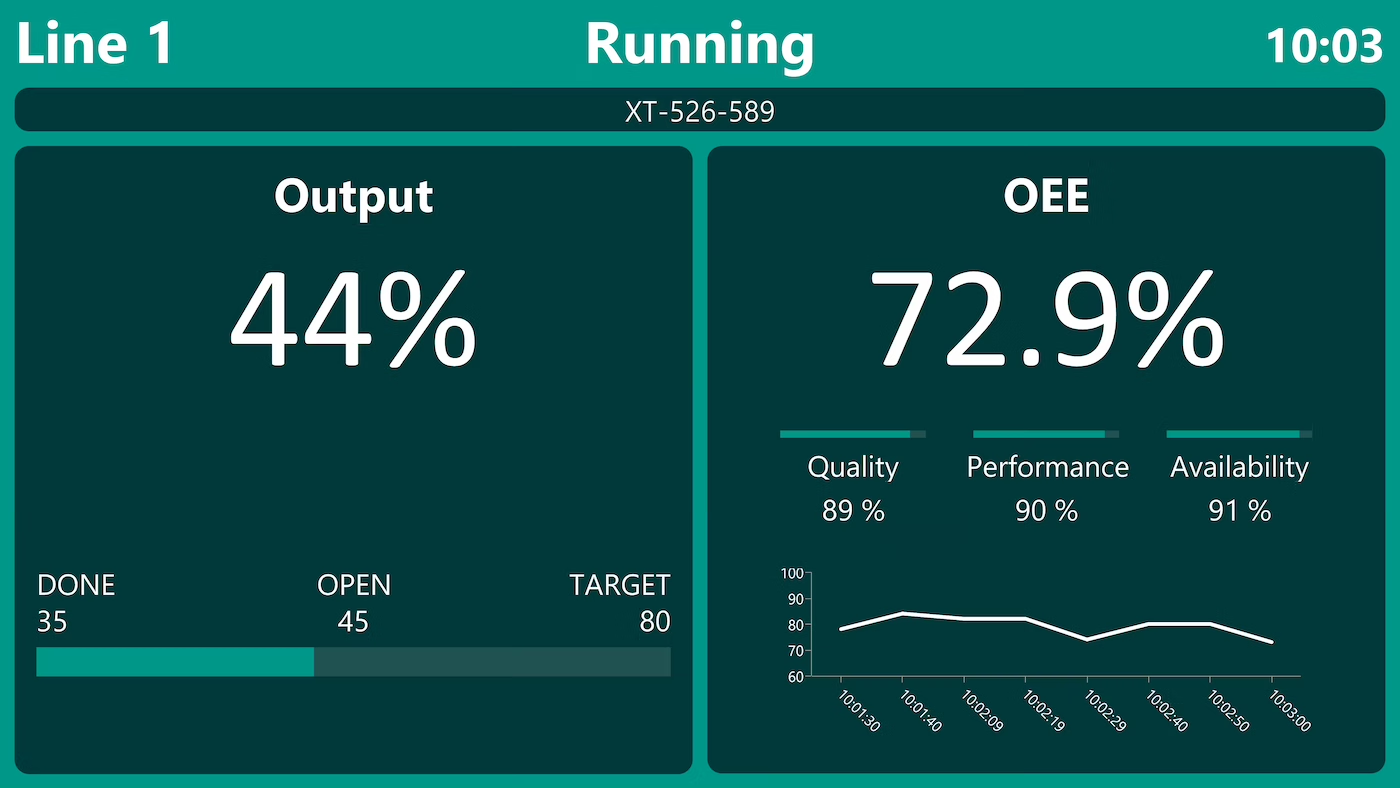
Machine status, OEE and cycle times for one line at a glance – spot bottlenecks instantly.
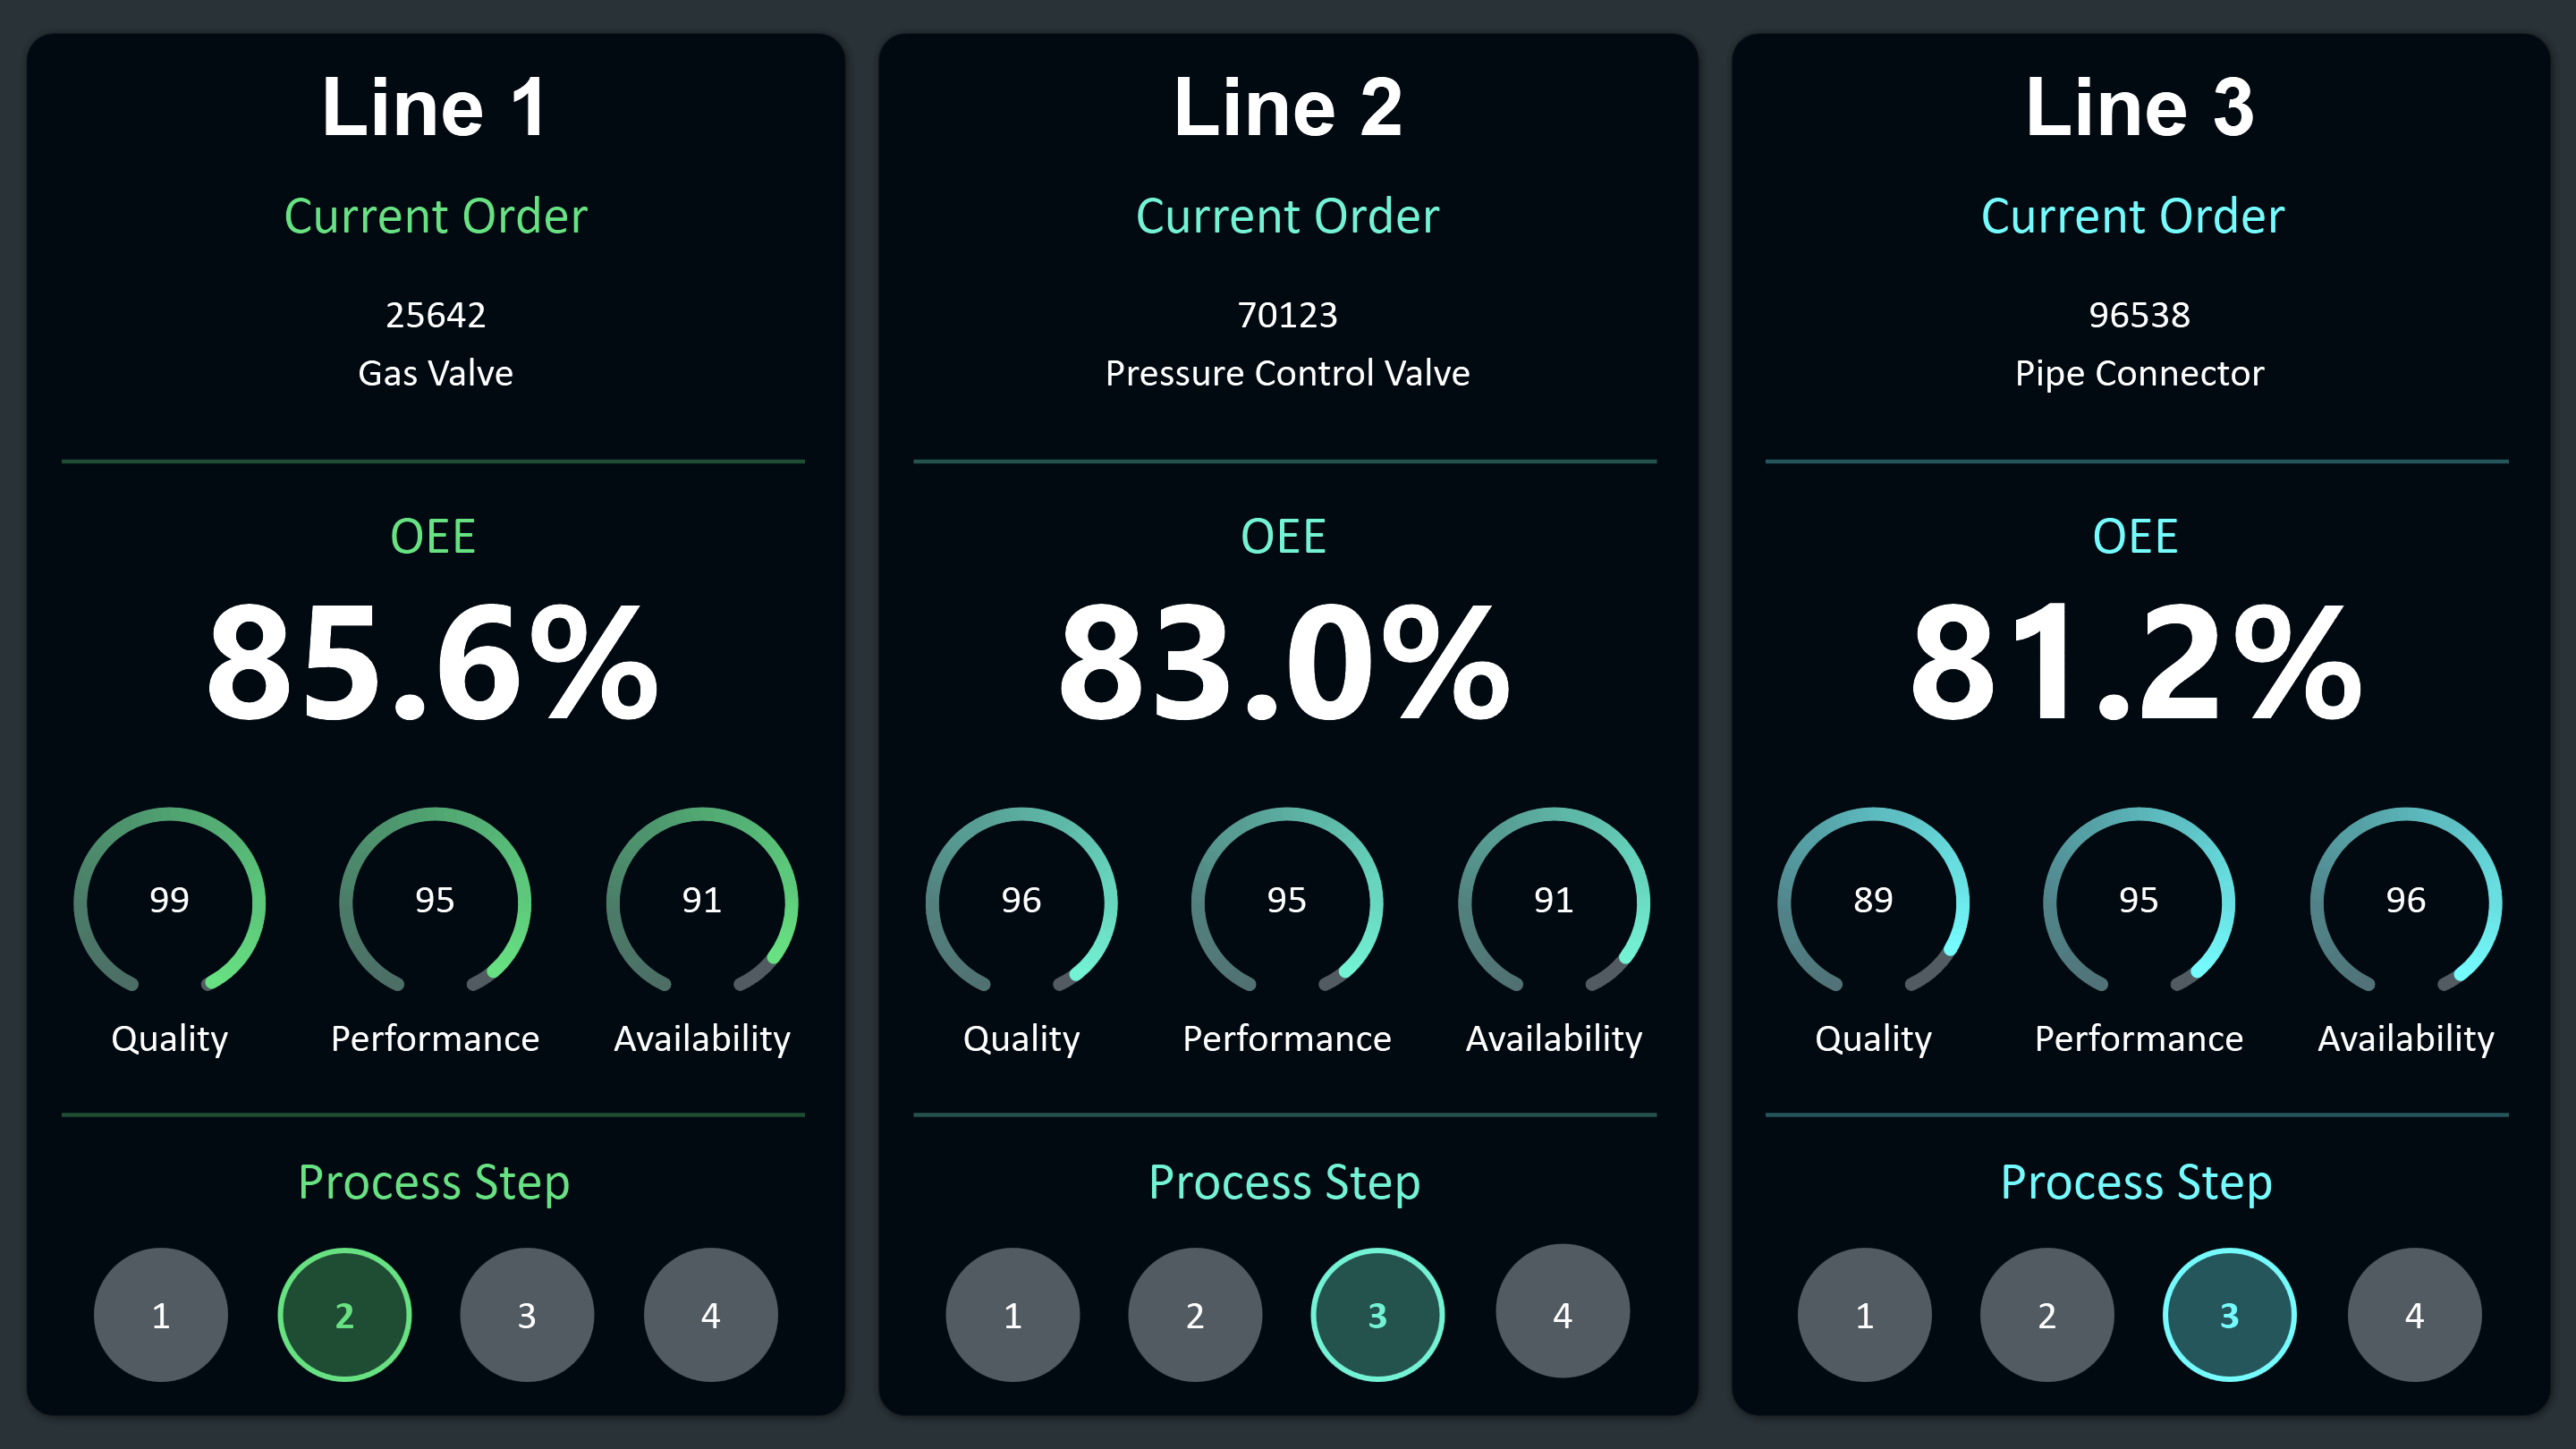
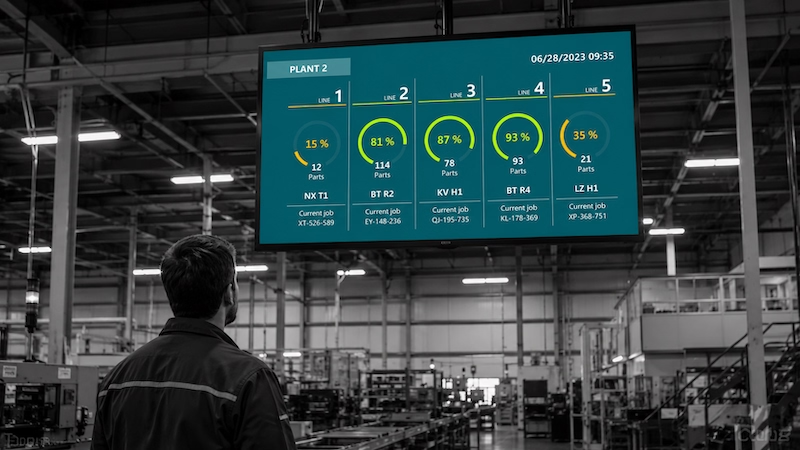
Machine status, OEE and faults across several lines in one view – made instantly visible with Andon.
.avif)
Cycle time, quality level and OEE for a production line, live on one screen.
.avif)
Show completed parts and the target quantity with the difference – plus OEE value, order data and status.
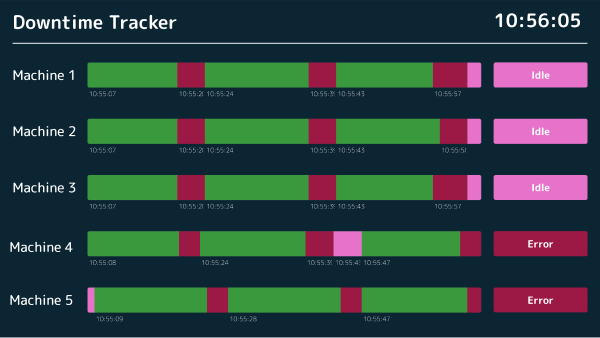
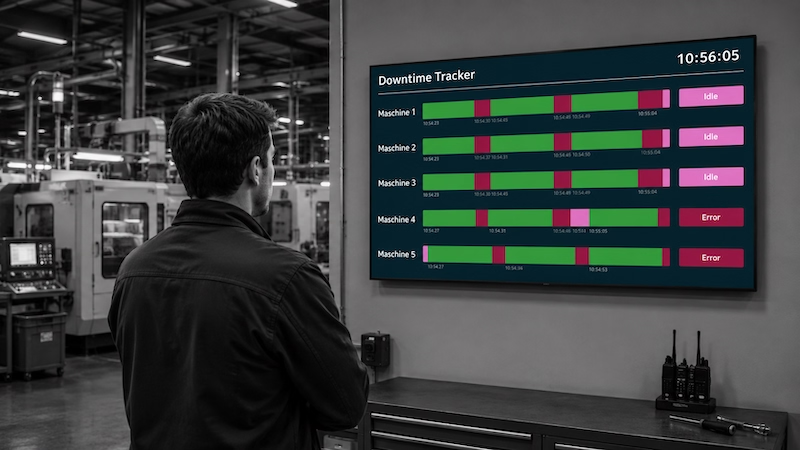
Capture machine downtime in real time, analyse root causes and cut outages for good.
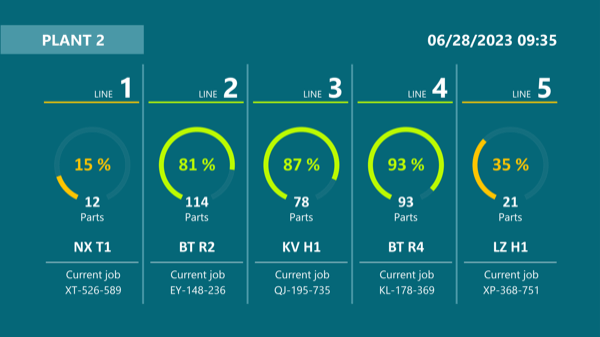
OEE, scrap and cycle times from single-unit, series and mixed production on one dashboard – decisions based on data.
.avif)
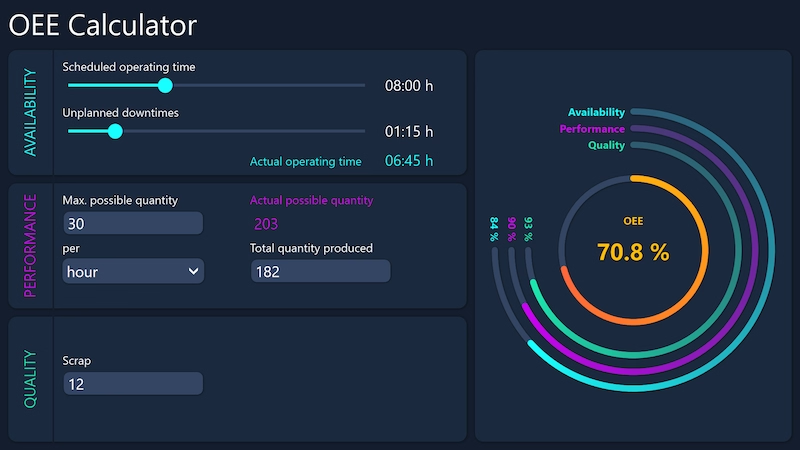
Enter planned values and actual figures – the OEE value is calculated and displayed straight away.
An OEE is only as good as what it is calculated from. With Peakboard, every value comes from a source you can name.
Run times, cycle, unit counts and scrap come straight from the controller. These are the numbers someone otherwise estimates at the end of the shift.
Typical connections:
Why a machine stopped is something the controller does not know. The operator taps the reason in on the screen – two seconds at the line, and the loss has a cause.
Typical entries:
If you want to compare values beyond a single shift, you can store them in Peakboard Hub. That makes comparable what is currently calculated a little differently in every plant.
This makes possible:
The OEE comes from live machine data rather than shift logs filled in later. That way it holds at the moment of the decision, not at the end of the month.

Drag & drop, low-code editor, and AI: departments build and customise their own applications — no IT ticket required.

Peakboard runs locally on your own network. Data never leaves your premises — no cloud dependency, no single point of failure.

Licensing is per display, not per user. Use as many employees, applications, and interfaces as you like on one device with no additional costs.

Start Immediately · No Appointment · Free
If you need support: You'll find tutorials and step-by-step guides on our Helpsite and our YouTube channel. For individual needs, we offer workshops and consulting.
In Conversation · With Industry Experts · 55 Min.
Discuss your specific use case with an industry expert – provide brief information about your use case beforehand, and we'll get straight to the point. You'll get a complete overview of all features and see what's possible with Peakboard in your environment.

OEE software calculates overall equipment effectiveness from the three factors availability, performance and quality, and shows it continuously. To do that it records run times, unit counts and scrap, assigns a reason to every loss and keeps the values for comparison across shifts and periods. Peakboard takes on this role without middleware – the application runs on a Peakboard Box or on existing Windows hardware inside your own network.
OEE is the product of availability, performance and quality. Availability relates actual run time to planned production time, performance relates the quantity achieved to the quantity possible at target speed, and quality relates good parts to total output. Peakboard shows the three factors separately, so it stays visible which one is pulling the figure down.
Run times, unit counts and scrap come straight from the machine controller, via OPC UA, Siemens S7, MQTT or Modbus. Target values, order data and inspection results are pulled in from SAP, MES or a SQL database. Both routes come together in the same application, with no system in between.
Yes. Where no interface exists, the operator reports downtime and its reason by touch at the terminal – these entries feed into the calculation just like automatically read values. For sensors and gateways, Peakboard works with partners such as Softing and Kepware.
If you want them to be. Where you need the history, the values can be stored in Peakboard Hub with a timestamp, which lets you compare shifts, lines and periods.


