Data connection with
Power BI
- Existing Power BI dashboards Integrate directly
- Real-time data and historical analysis Combine cleverly
- Individual visualization solutions for all areas of the company


Operational intelligence meets business intelligence
Peakboard and Power BI — that is the perfect combination of real-time operational transparency and strategic data analysis. With just a few clicks, you can integrate existing Power BI Tiles directly into your Peakboard application and add them where you really need them: on shop floor displays, info boards or interactive HMIs.
Whether you're already working with Power BI or are just developing your data strategy — Peakboard expands your BI solution with the ability to Up-to-date information visible, accessible and able to act to make.
Combine flexibly — Power BI + any data source
With Peakboard, you're not limited to a single data source. Combine your Power BI reports with live data from sources such as SAP, SQL, OPC UA, MES, or APIs — all within a single dashboard. This creates holistic information solutions that offer real added value for both managers and operational teams.
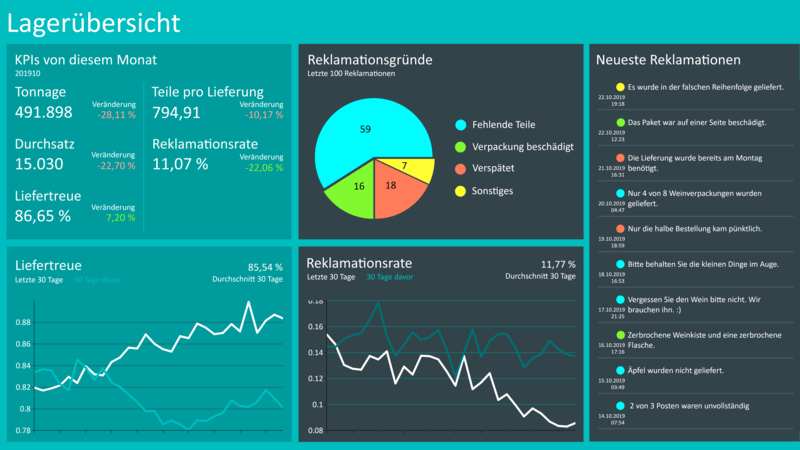
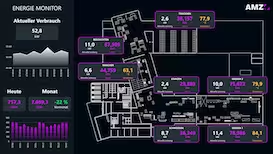
Your Power BI Tile shows OEE development over the last 30 days — and Peakboard supplements it with the current machine status right next to it. That is precisely the advantage of this connection.
From analysis to action
Peakboard not only enables display, but also interaction. With interactive elements such as buttons, filters, or responses to limits, you can control processes, enable inputs or forward messages — in real time. This turns your Power BI analysis into an operational recommendation that is effective directly at the scene of action.
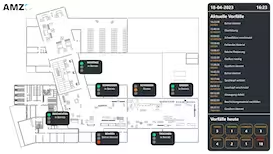
Visualization for every level — from shop floor to management
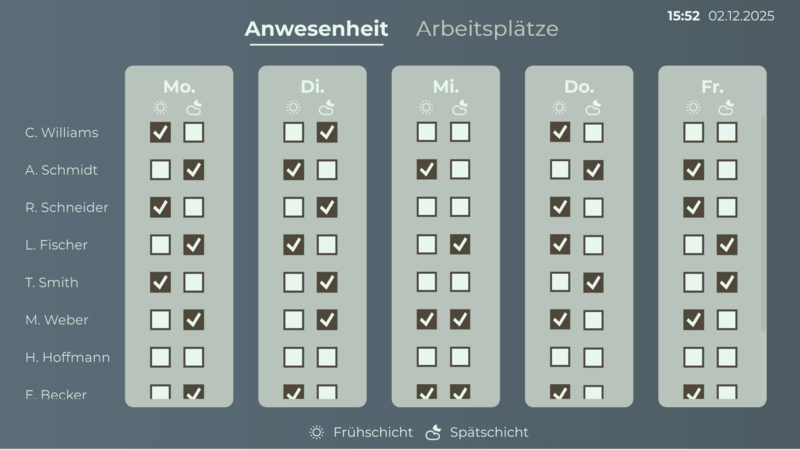
- production management receives live data & deviations directly into the meeting
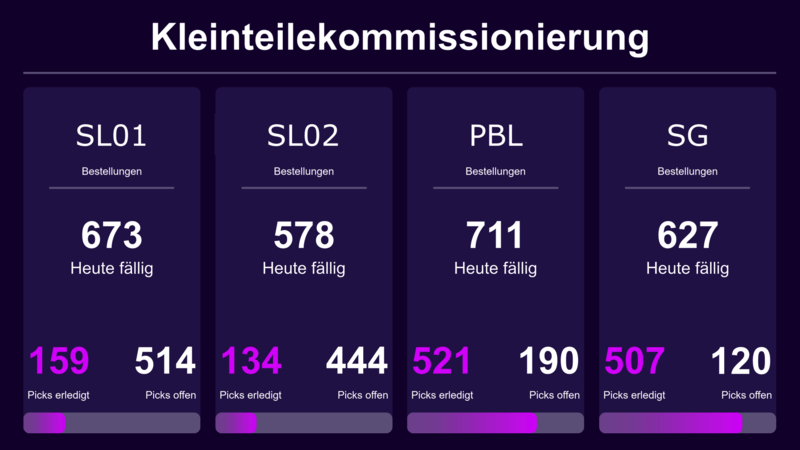
- Staff on the production line See at a glance what's currently counting
- Controlling & Management Analyze trends, capacities & outages
- upkeep Detects anomalies earlier — with a look at the display
This is what the interplay looks like
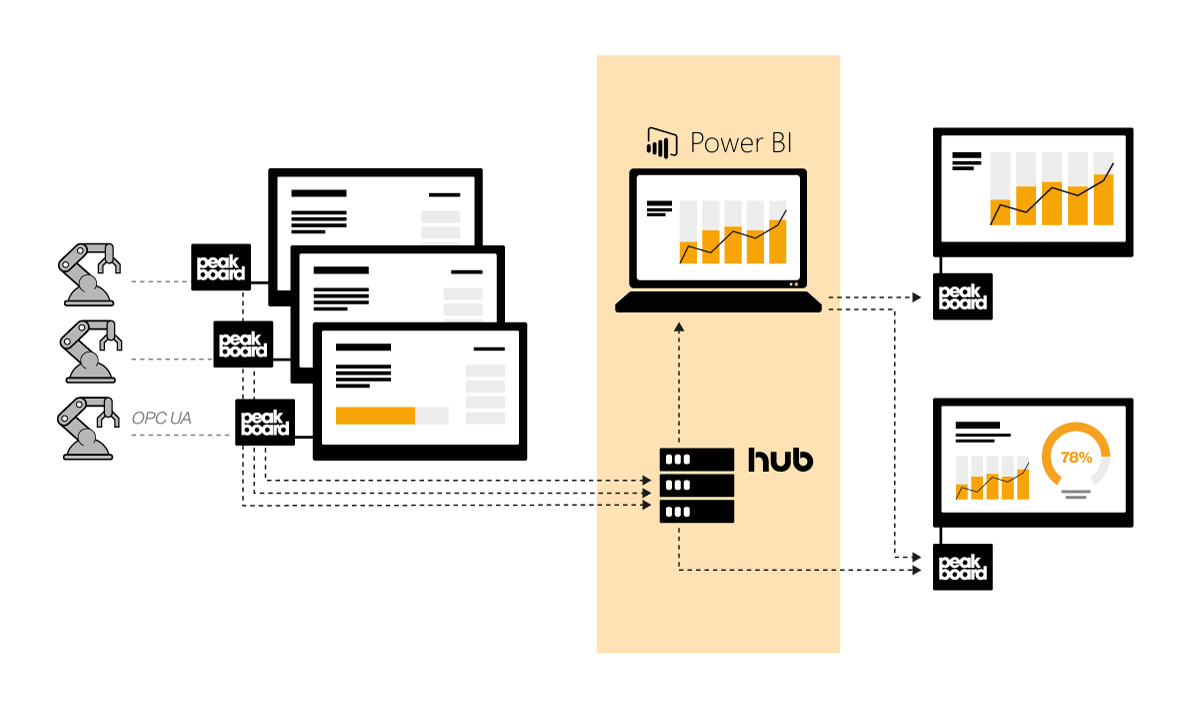
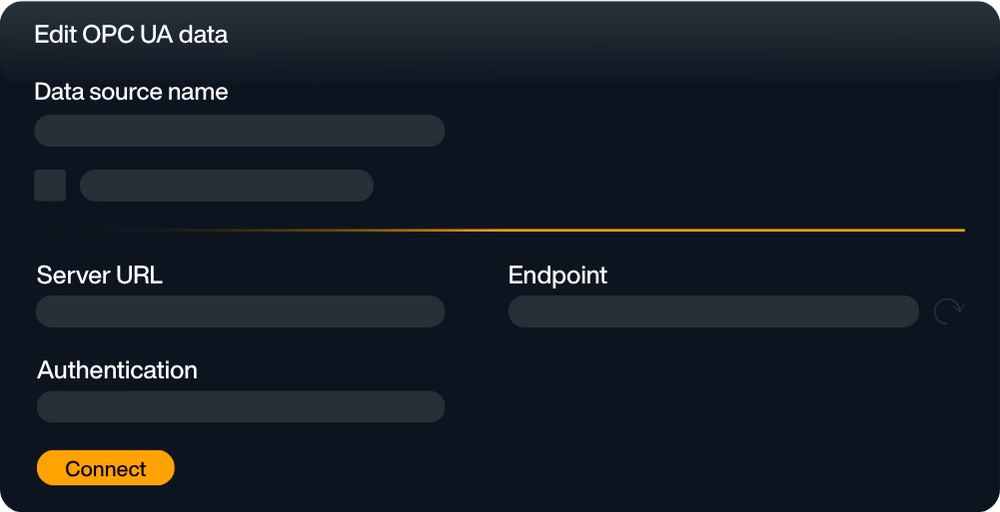
You can integrate Power BI dashboards directly into Peakboard — without any programming effort. Simply define the URL, access token and layout, done! In this way, you bring important BI evaluations exactly where they work: to the point of decision.
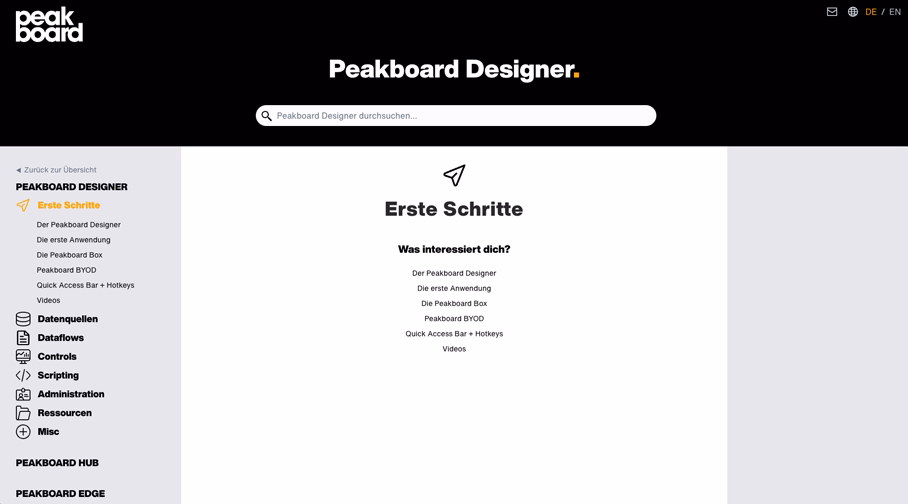
Start now for free with Peakboard Designer
Capture, process and visualize production and order data in real time — simply and without programming knowledge.


All of your data.
Peakboard connects your systems and brings all data to one platform — for visualization, automation and individual applications.


%201.svg)


%201.svg)


More information
for your start with Peakboard.


Save time with our templates
No time for long designs? No problem: Use one of the many ready-made templates for dashboards and applications — e.g. for production monitoring, warehouse management or quality assurance. Pick a template, customize it, and you're done.