DISPLAYS ON SITE
1 Display
EMPLOYEES
18
Data sources


1 License
One license per display

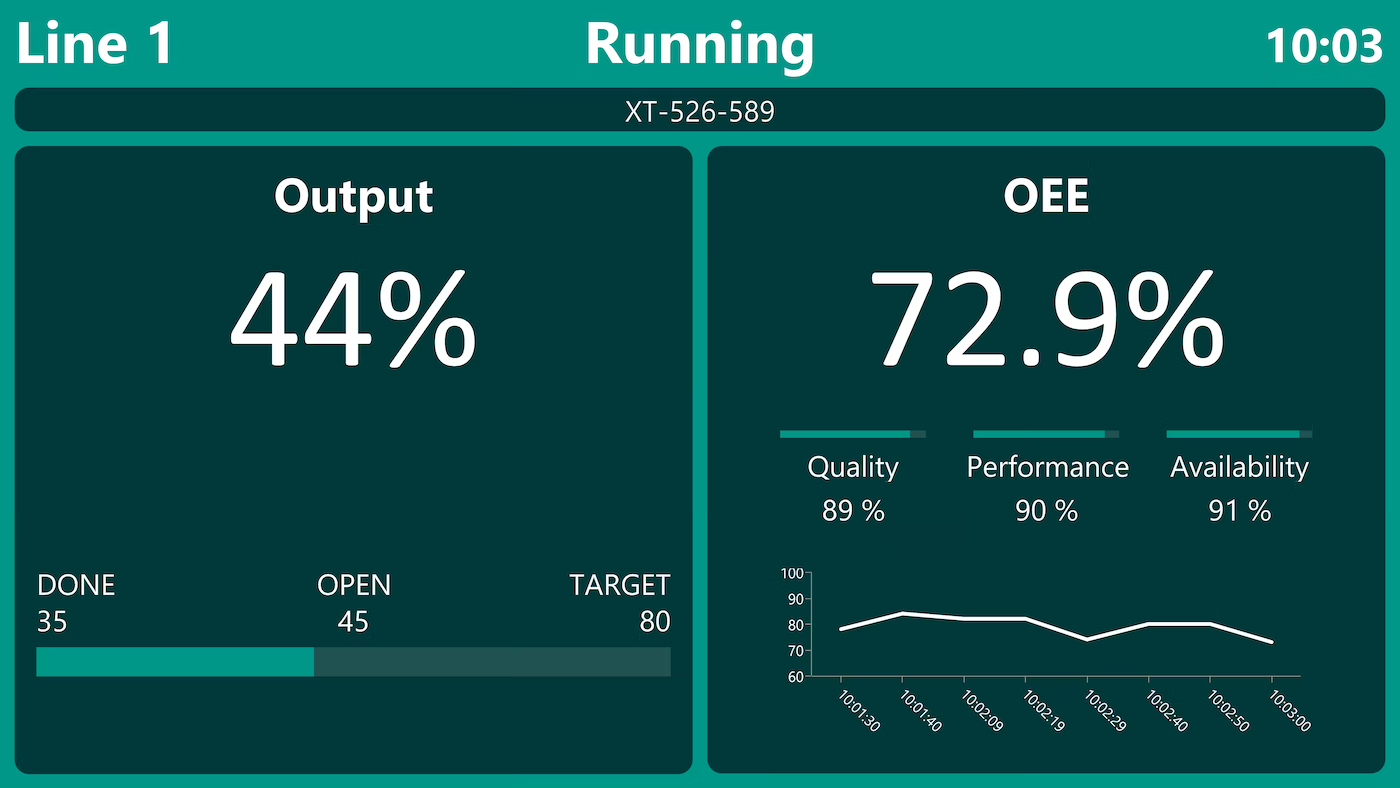
An OEE dashboard shows machine status, OEE metrics, and cycle times for a production line in real time—at a glance. With Peakboard, you spot bottlenecks instantly, reduce downtime, and make decisions based on current data—with no programming required.


Lack of production line transparency.
Slow response to faults.
Missing real-time data on KPIs and machine status.
Native SAP connector, OPC UA, MQTT, and dozens of other sources are available out-of-the-box. You just connect, instead of integrating – and the data appears directly at the shop floor.


%201.svg)


%201.svg)


A new metric, a different layout, an extra data source—thanks to the low-code editor and Peakbot, you can adapt the OEE dashboard yourself, without programming skills.
Whether on the Peakboard Box or your own hardware—both run 100% on-prem, with no single point of failure and no cloud dependency.
Device-based pricing instead of user-based licenses: one license per display, unlimited users per device. More employees on the same display cost nothing extra.


Introducing an OEE dashboard shouldn't take a year. With Peakboard, you start immediately—no appointment, no major IT project.

Start Immediately · No Appointment · Free
If you need support: You'll find tutorials and step-by-step guides on our Helpsite and our YouTube channel. For individual needs, we offer workshops and consulting.
In conversation · With experts · 55 min.
Discuss your specific use case with an expert – briefly provide information about your use case beforehand, and we'll get straight to the point.
You'll get a complete overview of all features and see what's possible with Peakboard in your environment.

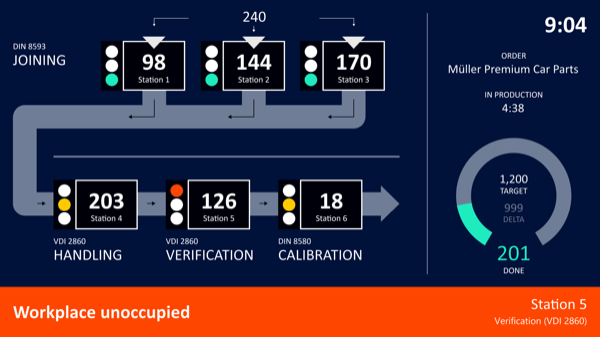
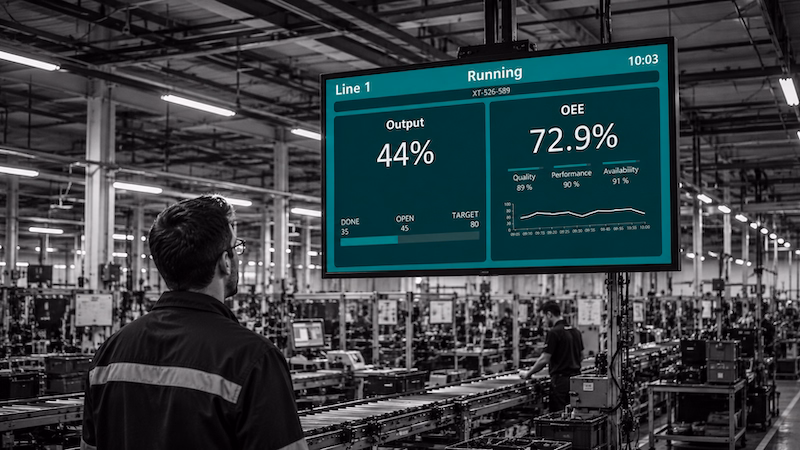
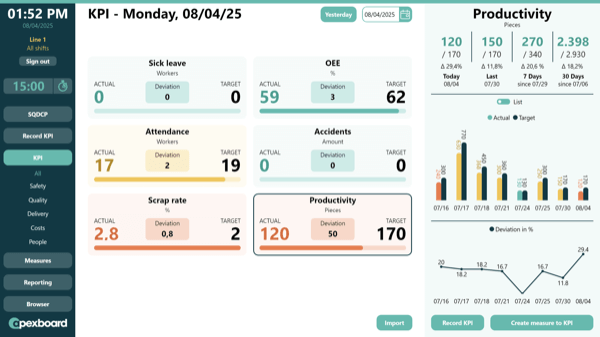
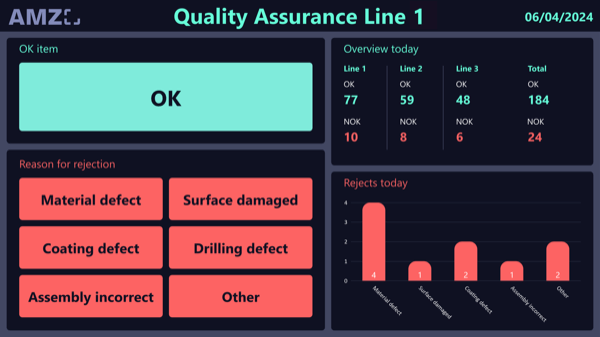
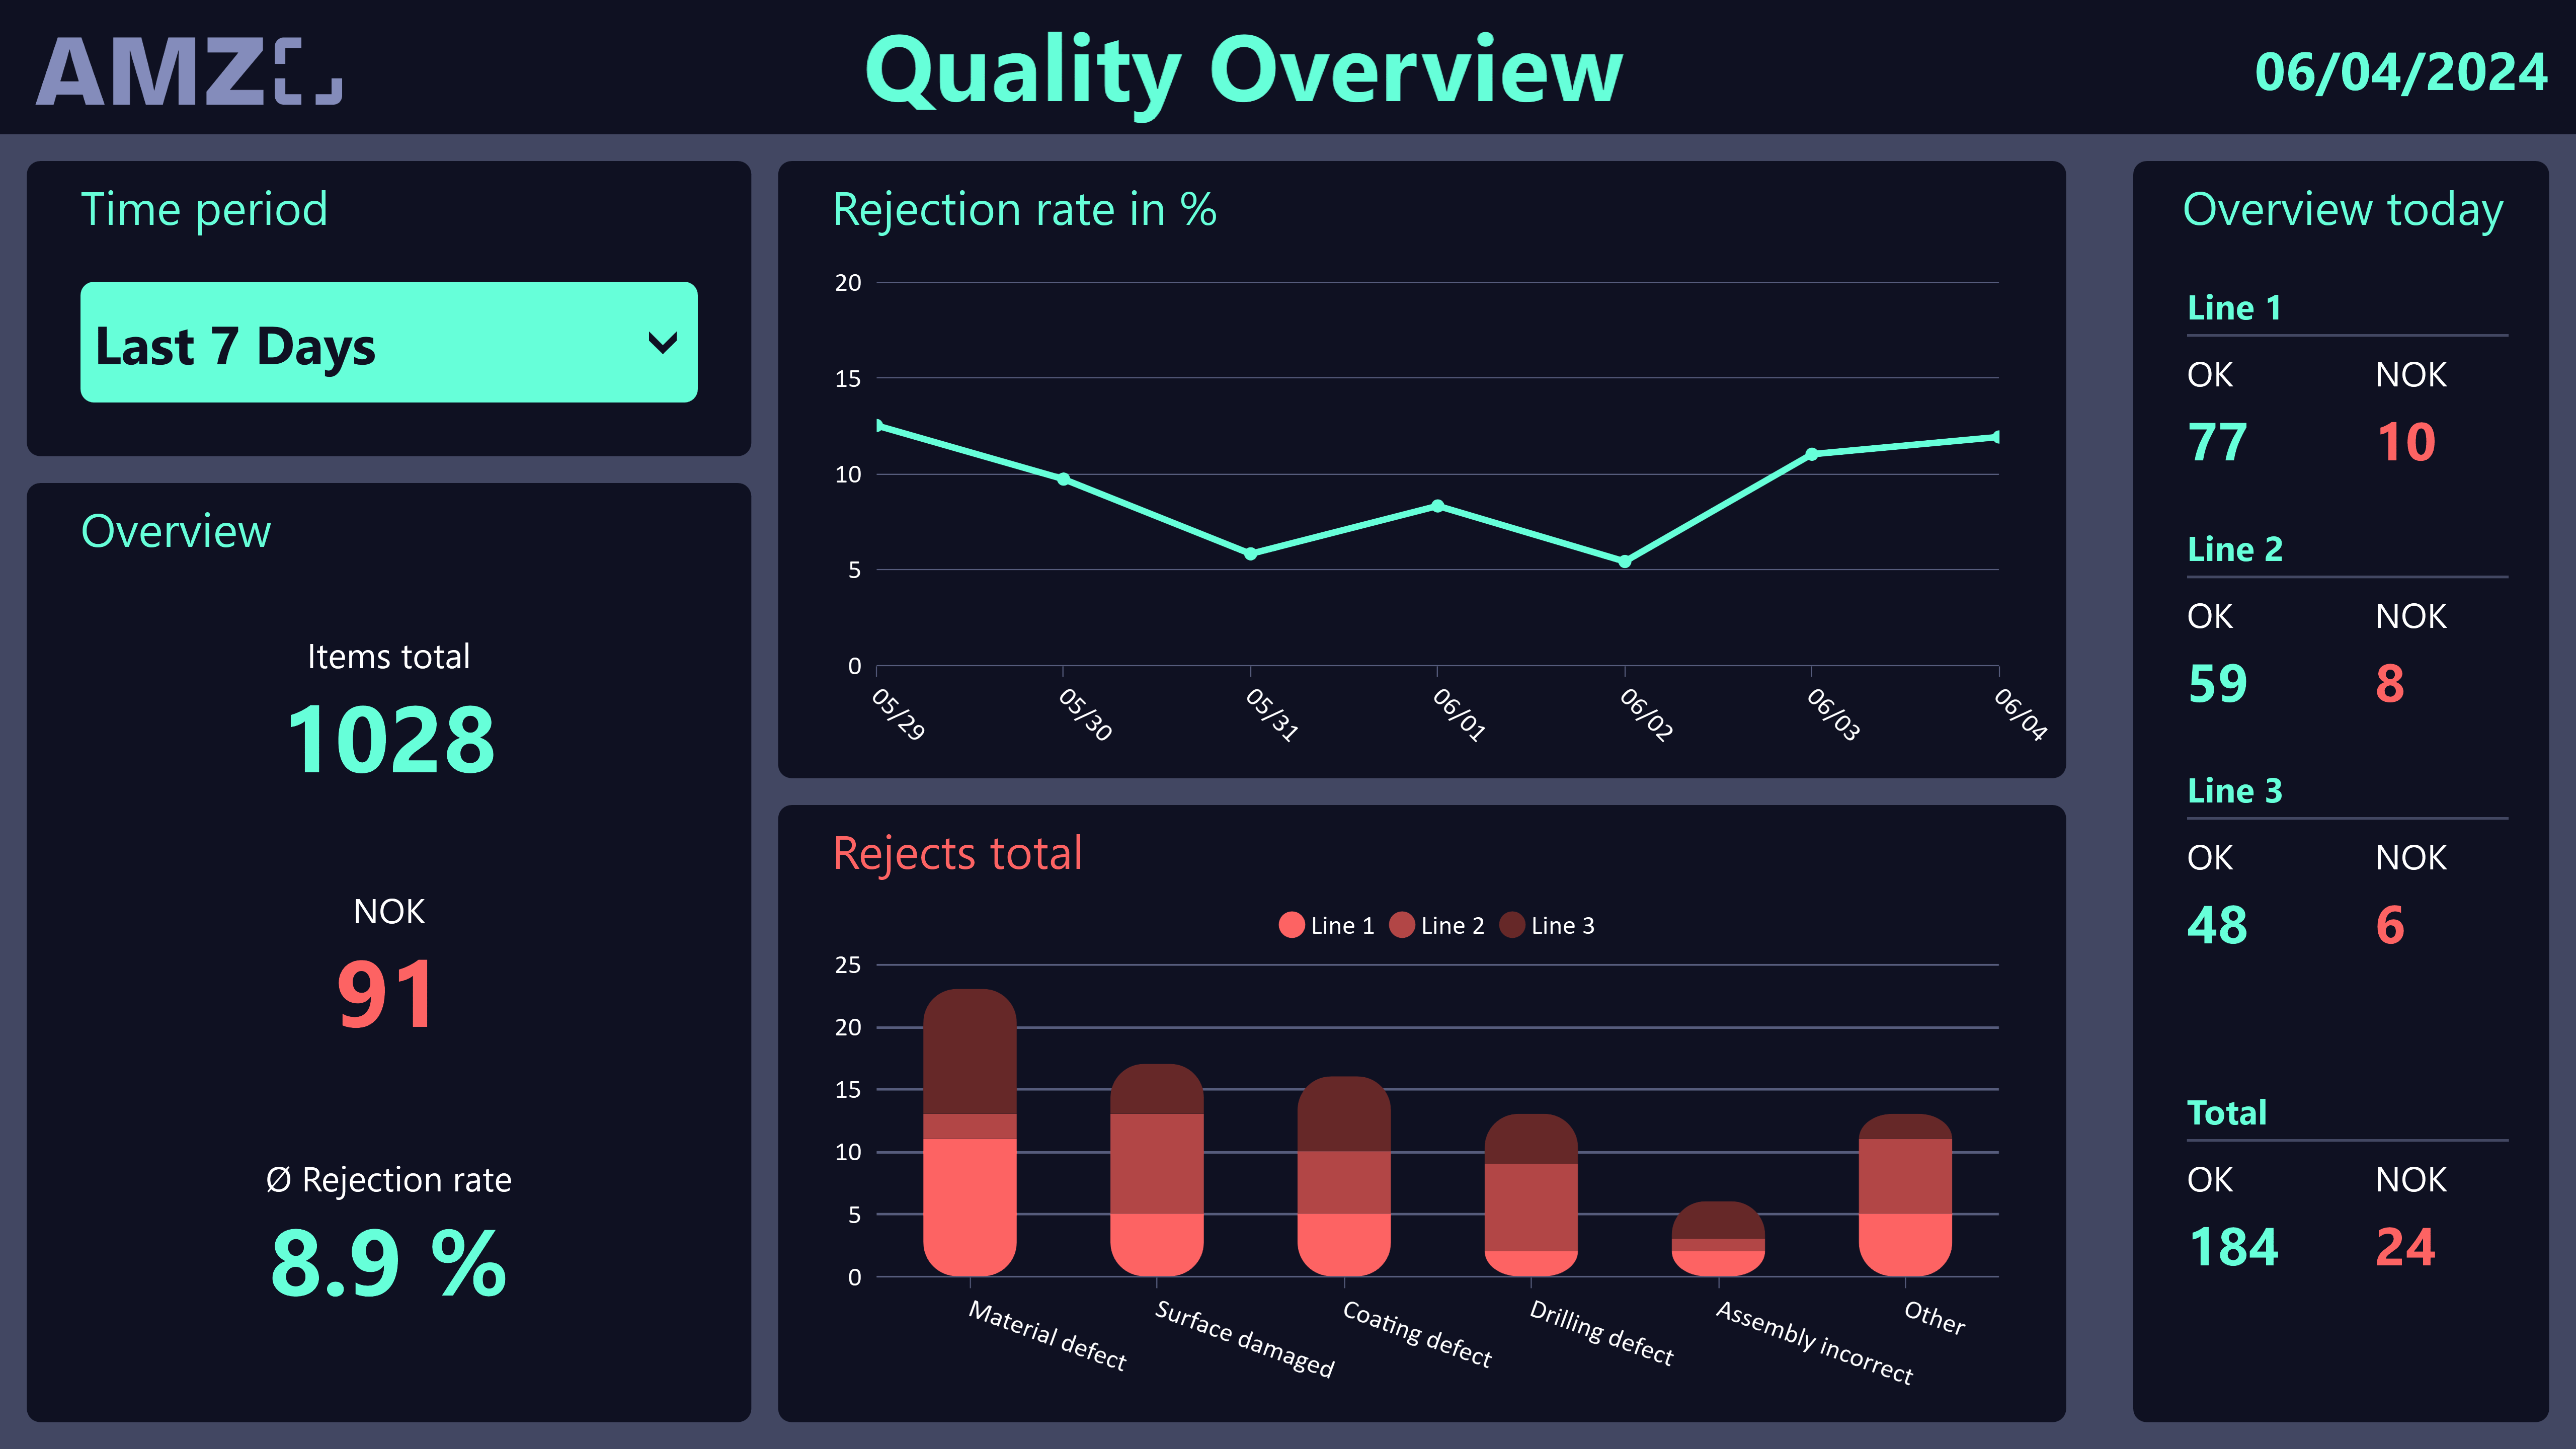
The OEE dashboard bundles all relevant key figures of a production line in a central, digital application. Machine status, OEE, processing times and order progress are clearly presented so that teams can react immediately and manage processes efficiently.
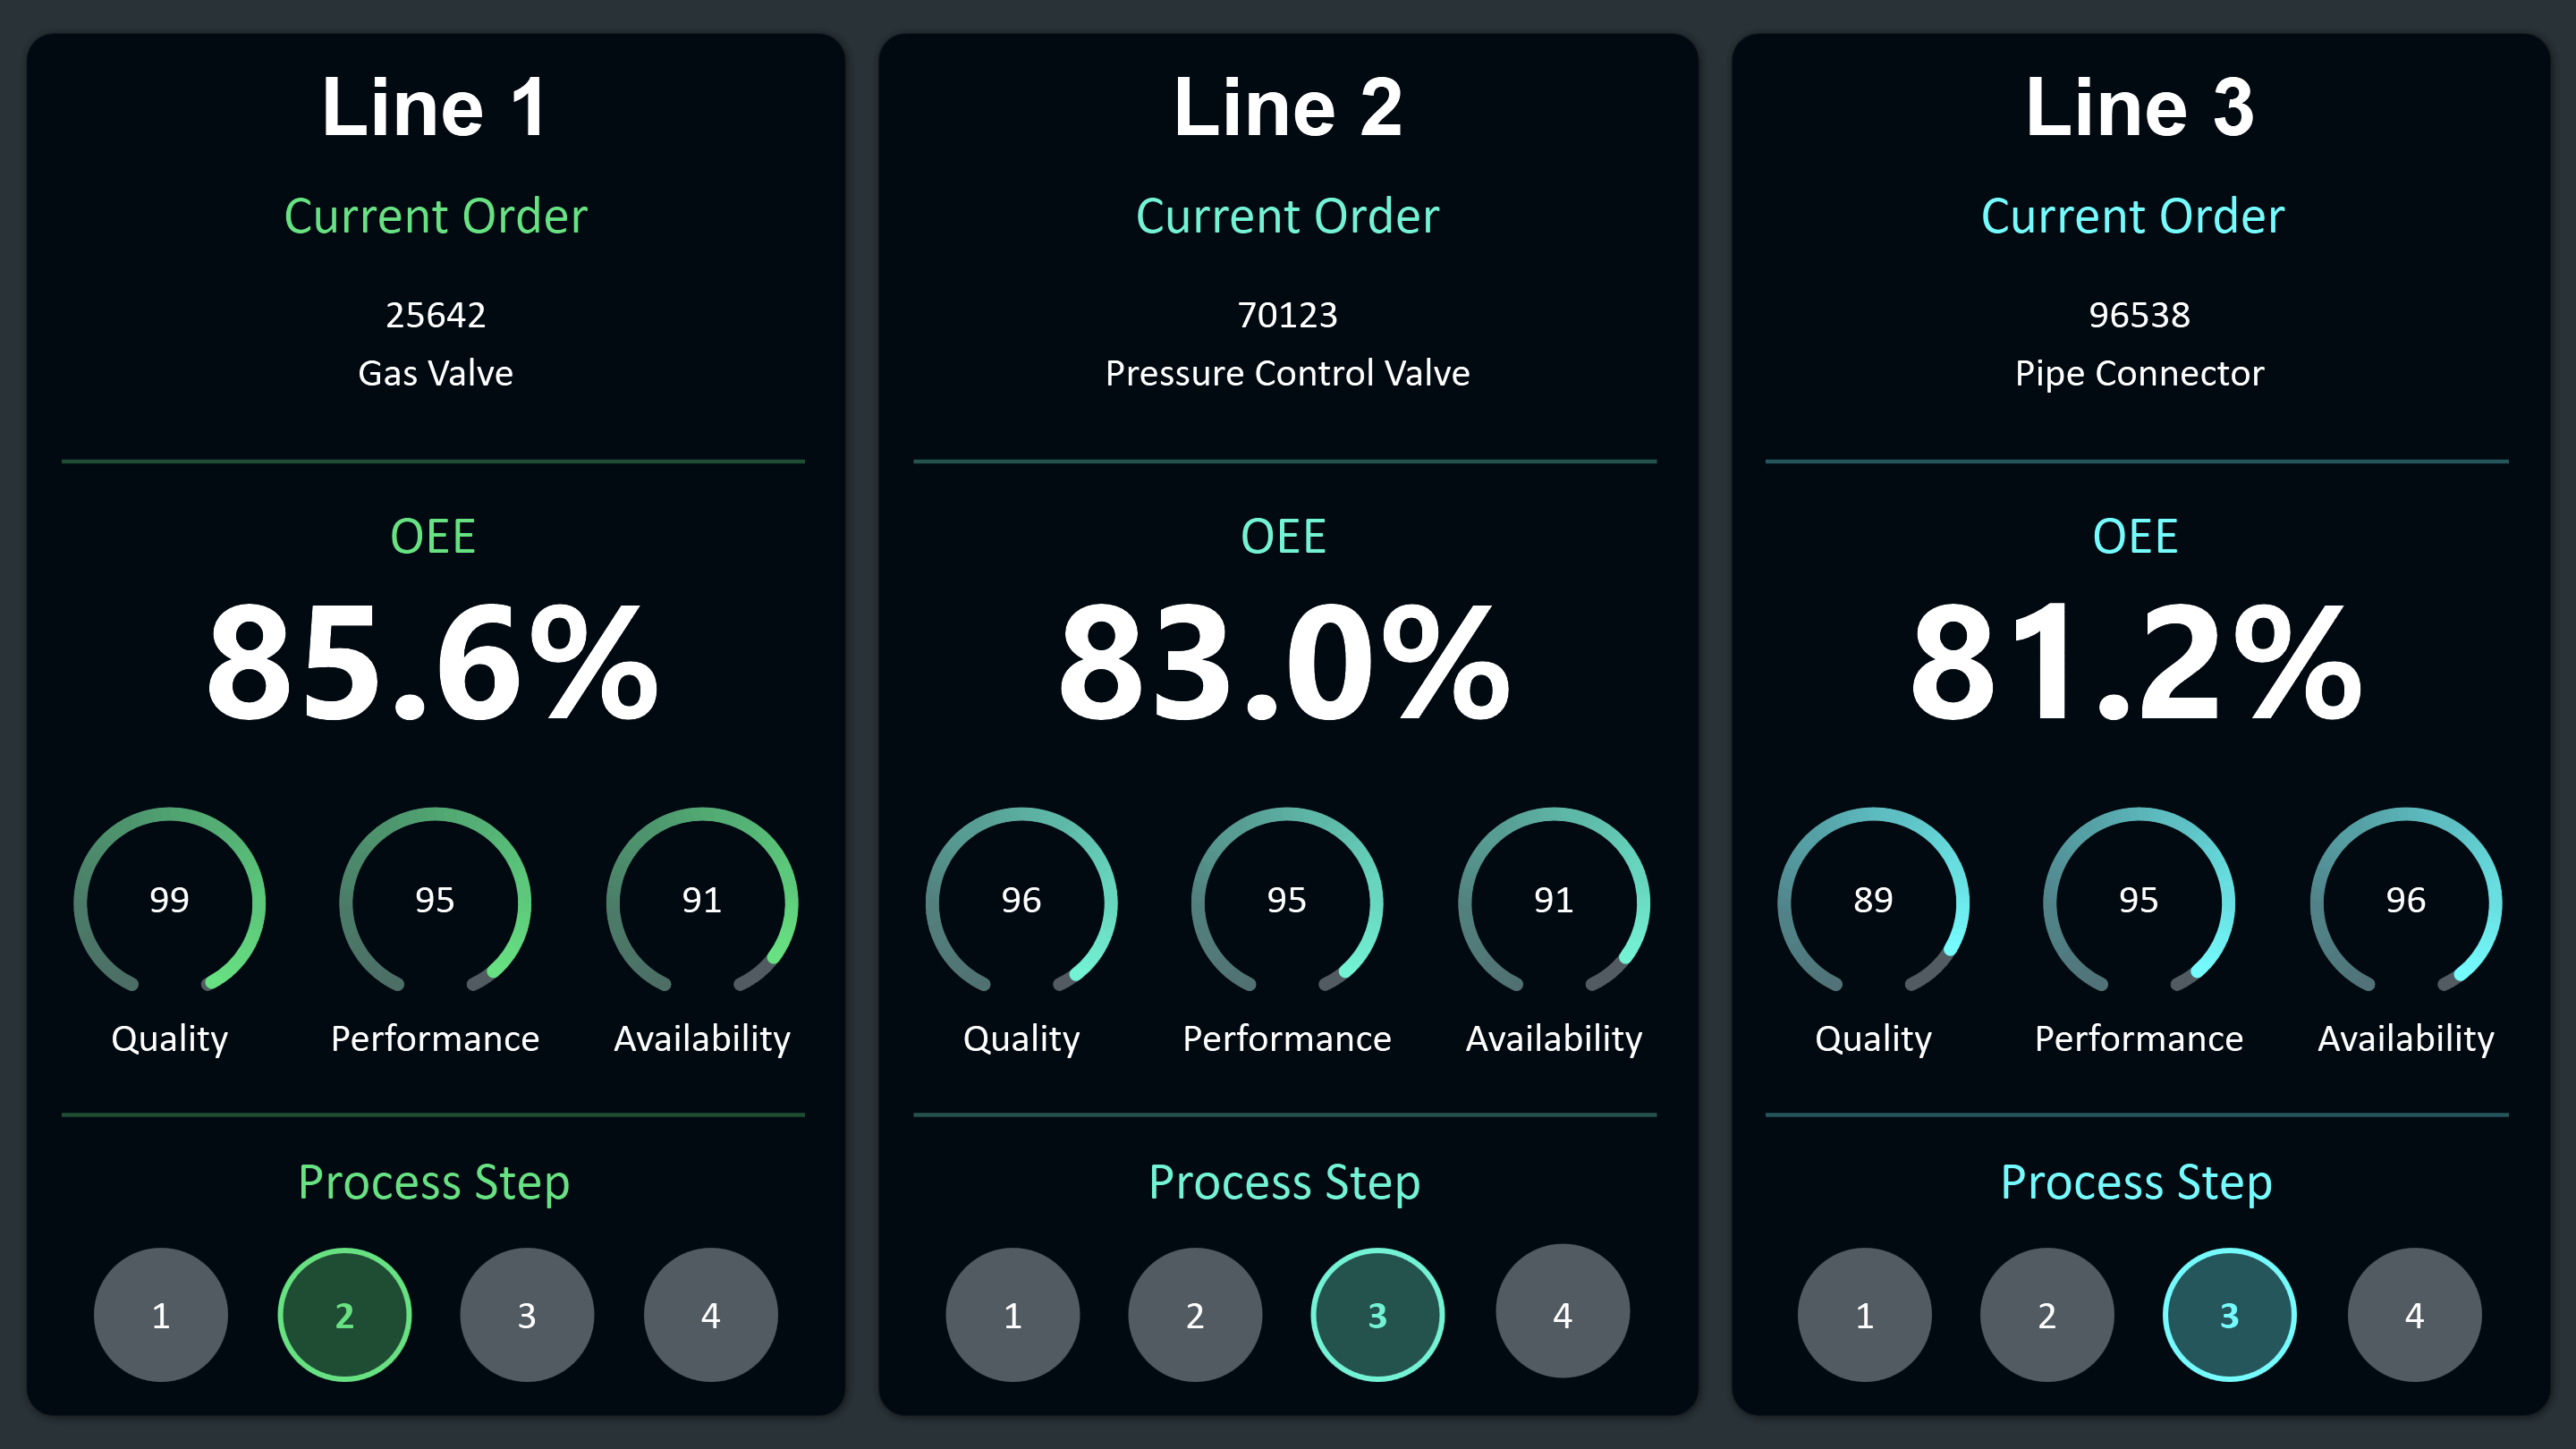
An OEE dashboard visualizes the Overall Equipment Effectiveness of a production line in real time — availability, performance, and quality at a glance. With Peakboard, the OEE dashboard is built in a low-code editor and connects directly to machine controls such as Siemens S7, OPC UA, or MQTT.
OEE = Availability × Performance × Quality. Availability compares actual run time to planned time, performance compares actual to ideal cycle time, and quality is the share of good parts. Peakboard computes all three automatically from live machine data.
An OEE dashboard shows immediately where a line falls short of target — whether through downtime, speed, or quality losses. That enables targeted action instead of gut-feel decisions.
Peakboard reads machine data via OPC UA, Siemens S7, MQTT, or REST API and calculates OEE automatically in real time. Scrap reasons can be entered manually on a touchscreen, and all data is stored in the Peakboard Hub for historical analysis.
OEE, availability, performance rate, quality rate, cycle time, good and scrap counts, and downtime with cause categorization.
Peakboard runs fully on-premises on your own network. Machine data and production KPIs never leave the company, with no cloud requirement and no cloud dependency — you keep full control of your data.