DISPLAYS ON SITE
1 Display
EMPLOYEES
18
Data sources


1 License
One license per display

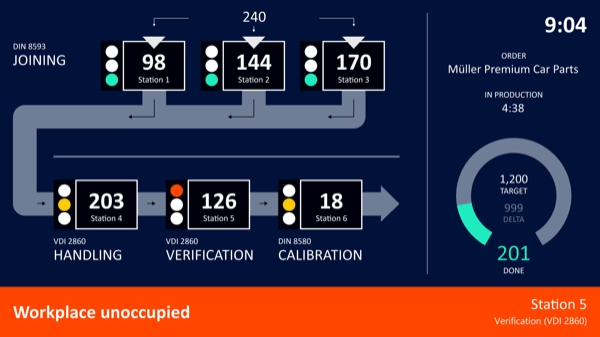
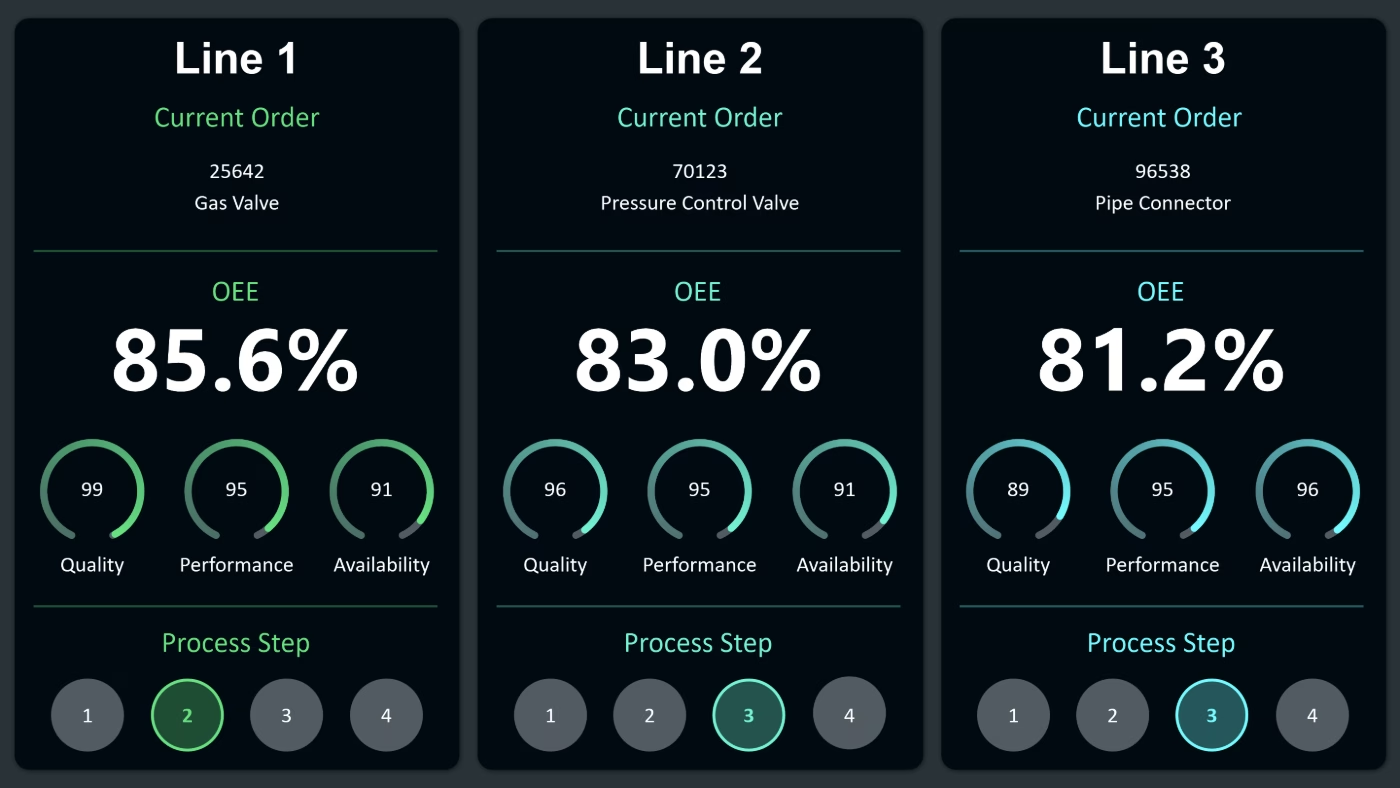
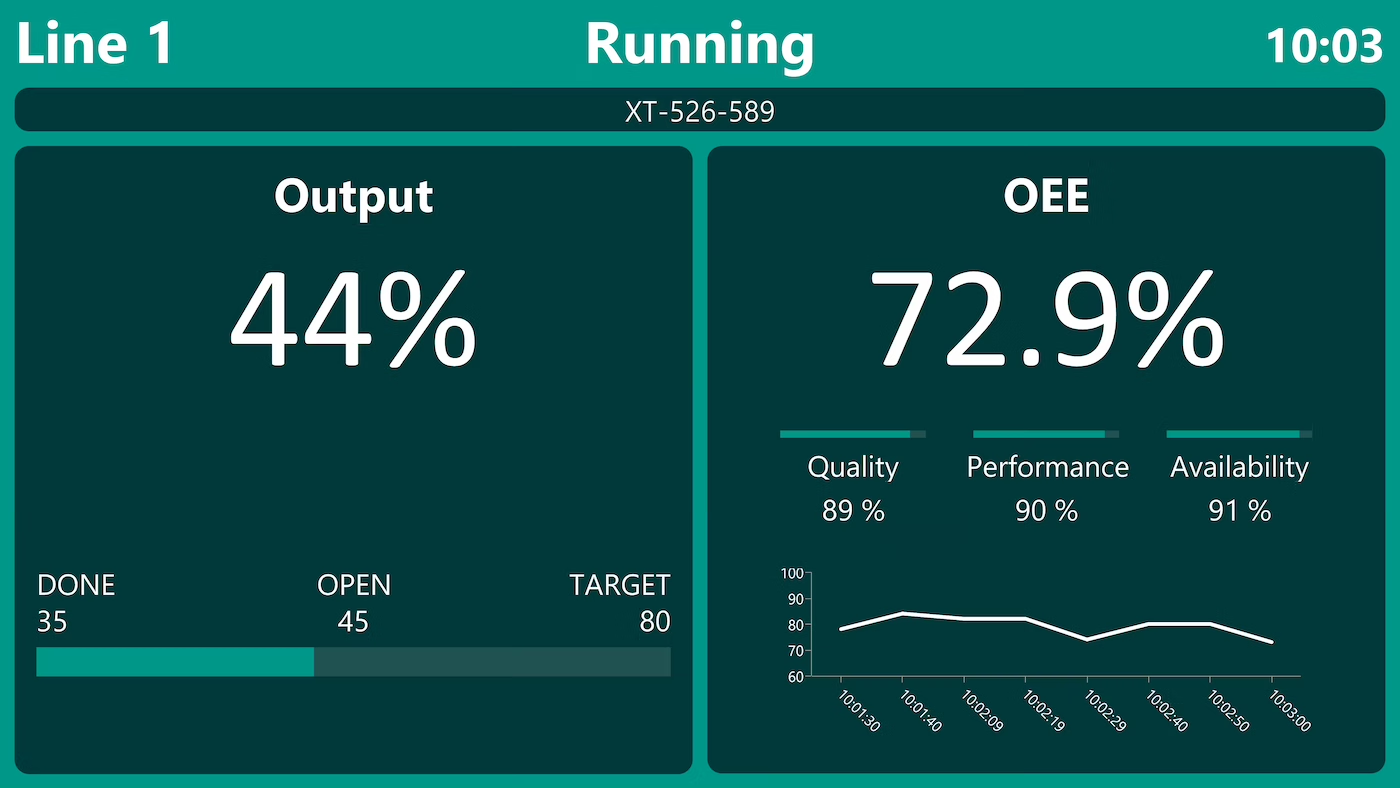
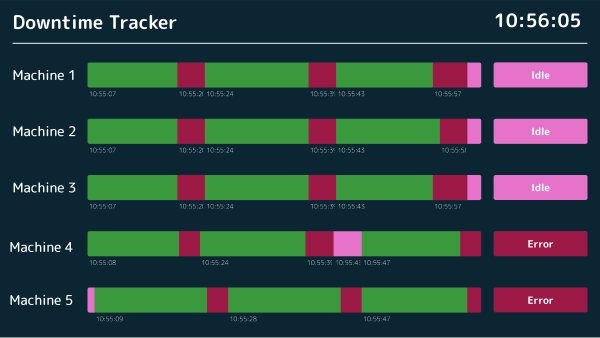
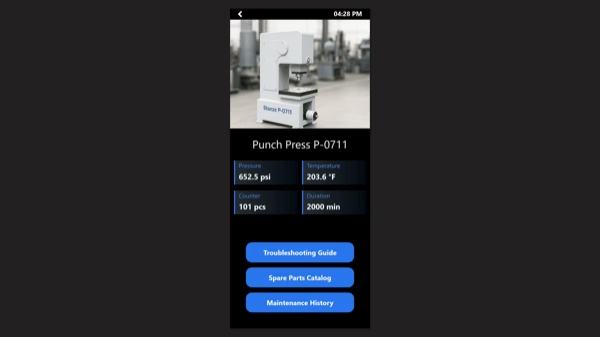
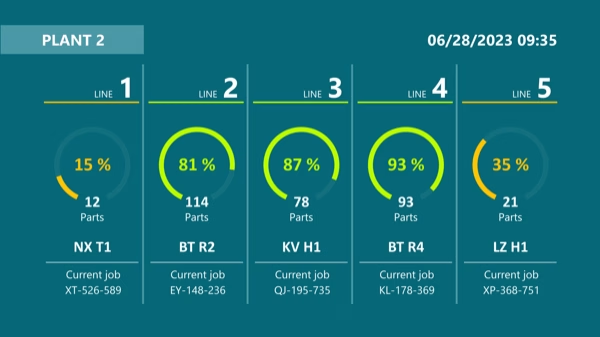
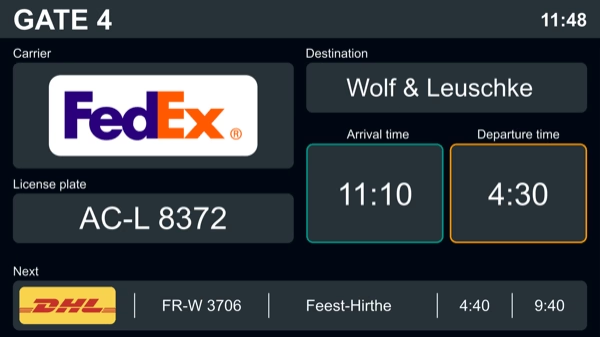
This dashboard monitors several production lines at once—machine status, OEE metrics, and faults in one real-time view, with an integrated Andon system. With Peakboard, teams spot problems instantly, react faster, and raise efficiency across every line—with no programming required.


No real-time visibility across multiple lines.
Slow response to production faults.
High manual effort for KPI evaluation.
Native SAP connector, OPC UA, MQTT, and dozens of other sources are available out-of-the-box. You just connect, instead of integrating – and the data appears directly at the shop floor.


%201.svg)


%201.svg)


A new line, a different alarm level, an extra data source—thanks to the low-code editor and Peakbot, you can adapt the Andon board yourself, without programming skills.
Whether on the Peakboard Box or your own hardware—both run 100% on-prem, with no single point of failure and no cloud dependency.
Device-based pricing instead of user-based licenses: one license per display, unlimited users per device. More employees on the same display cost nothing extra.



Introducing OEE monitoring for multiple lines shouldn't take a year. With Peakboard, you start immediately—no appointment, no major IT project.


Start Immediately · No Appointment · Free
If you need support: You'll find tutorials and step-by-step guides on our Helpsite and our YouTube channel. For individual needs, we offer workshops and consulting.
In conversation · With experts · 55 min.
Discuss your specific use case with an expert – briefly provide information about your use case beforehand, and we'll get straight to the point.
You'll get a complete overview of all features and see what's possible with Peakboard in your environment.

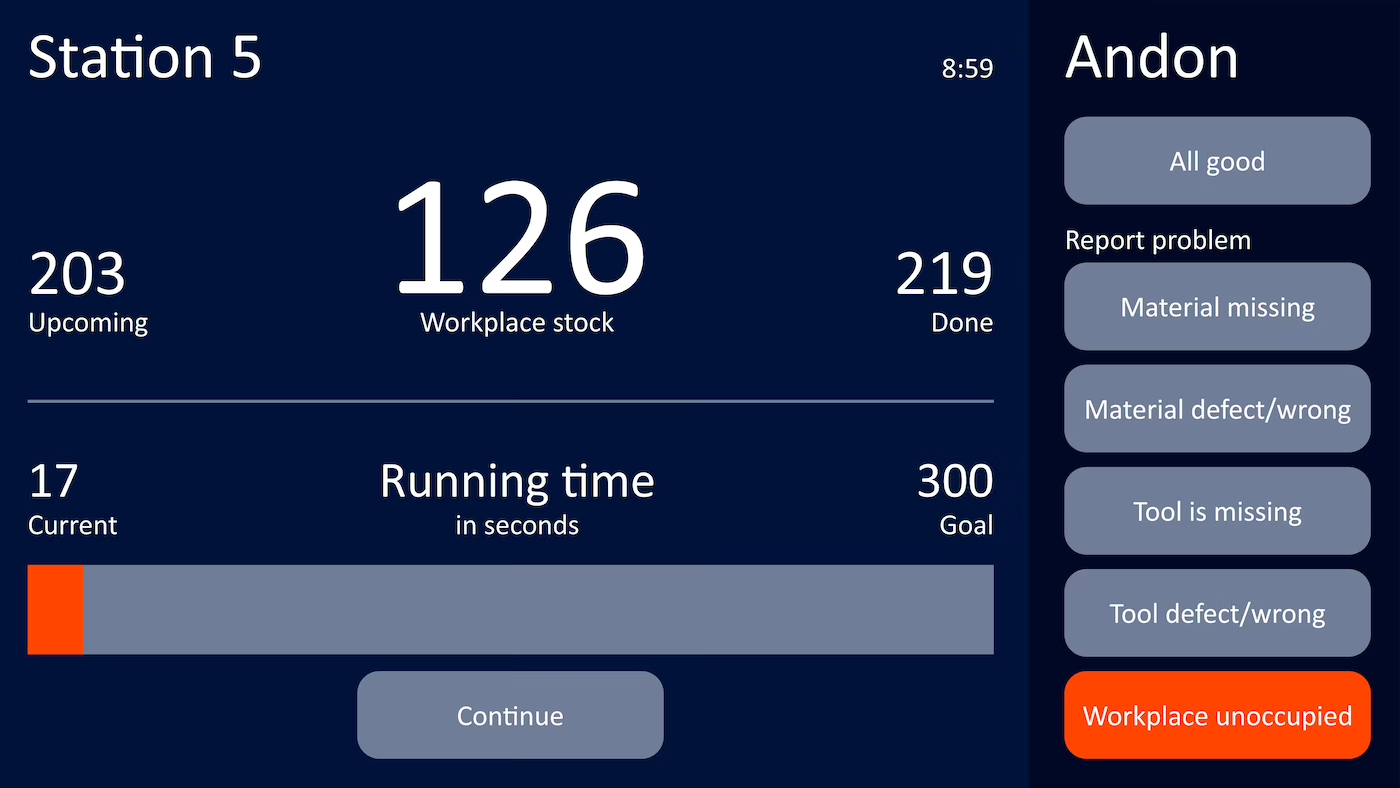
The digital Andon board makes production visible and controllable across multiple lines. Andon lights and alarm functions show deviations immediately, so measures can be taken straight away. This reduces downtime, minimizes errors, and increases transparency.
With OEE software, the same values can be compared across every line: which line was down and for how long, where scrap occurs, and how both develop over the week.
A multi-line OEE dashboard monitors several production lines at once on a single screen — machine status, OEE figures, and faults become visible in real time via an Andon system. With Peakboard you connect every line via OPC UA, Siemens S7, or MQTT and see the state of your whole shop floor at a glance.
Several lines in view at once: a problem on one line shows instantly through the Andon signal, without anyone checking physically. Shift leaders and managers can act before a stoppage escalates.
Peakboard reads machine data from all lines via OPC UA, Siemens S7, or MQTT and presents it in one overview. Each line shows OEE, machine status, and current faults, and the Peakboard Hub stores the data for historical analysis.
OEE per line, machine status (running, fault, or stopped), the Andon signal on fault, good and scrap counts, availability, performance rate, and quality rate.
Yes. New lines, changed thresholds, or additional KPIs are adjusted in the Peakboard Designer with low-code or Peakbot — no IT project.
Peakboard runs fully on-premises. Machine data and production KPIs never leave the company, with no cloud requirement and no cloud dependency — you keep full control of your data.