From sensor to actuator: How data is revolutionizing production
Sensors and actuators collect signals and convert them. But only if these signals are then evaluated and visualized in an understandable way can they also close the gap between the real and the virtual world.
18.03.2024
·
3 min read
- Sensors measure physical quantities and convert them into electrical signals.
- Actuators do the reverse: they turn signals into mechanical movement.
- Sensor data on dashboards makes production transparent and controllable.
- Only sensor data that has been made usable truly raises efficiency.
What exactly are sensors and actuators?
Sensors are devices that can measure a specific property. They are designed in a variety of ways and can therefore be used in a variety of ways. Some temperature sensors, for example, use a hot conductor whose resistance decreases as the temperature rises. The resistance is finally converted into voltage and read out by a microcontroller. A motion detector, in turn, makes it possible, as its name suggests, to detect movements. It is usually used to detect whether an object is moving within or outside the sensor area.
From physical quantities to electrical signals and mechanical movements
In summary, sensors convert physical quantities such as temperature, pressure, speed, fill level, etc. into electrical signals and transmit them to a control device. A distinction is made between active and passive sensors. Active sensors are sensors with internal, amplifying, or signal-forming components that generate an electrical signal. Passive sensors, in turn, contain components such as coils, resistors or capacitors and emit signals in the form of analog voltage. Another difference between active and passive sensors is that active sensors require external power, while passive sensors can be operated without an external power supply from, for example, a battery or a power outlet.
What all sensors have in common, however, is the ability to receive input and pass it on in the form of data. The transmitted information is then processed via a control device and output via an actuator. Actuators convert the control device control commands available in digital or analog form into mechanical movements or other physical quantities, such as pressure or temperature.

Maximize your industry's efficiency with data from sensors
Sensors can provide two types of data. On the one hand, this is the data that is constantly determined, such as temperature or pressure. This data is provided in the form of an uninterrupted data stream. On the other hand, there is data that is only collected for specific events, for example when an object moves past a motion detector. This data is called event data.
The data volumes are stored in a database, from which they can either be analyzed or further processed. The database serves as a central point of contact for all those who need the sensor data to complete their tasks.
In order to communicate the data in an understandable and effective way, you now need the right solution, such as Peakboard. Peakboard is designed to process data from a wide range of data sources, including databases. However, the data at this point could also come from an MES or ERP system. Data from SAP, Microsoft Azure, Dynamics NAV or Oracle can be easily connected and output to monitors exactly where it is needed. Our shows exactly which interfaces can be displayed with Peakboard Overview of data connections. As an IoT solution, Peakboard can be used in automation to visualize data from sensors. Information about path lengths, distances, pressure, temperature, position, force and much more can be measured and displayed individually in the form of a dashboard.

The advantage of sensor-based data visualization on dashboards
The big advantage of a dashboard in production is obvious: With the data, which is visualized and made available in real time, work processes can be made more efficient, effective and safer. In addition, the data is made available exactly where it is needed. Right on the machine, can be used directly by employees. On our website, we show exactly which areas of application Peakboard covers in automation, and here is an example of what practical implementation can look like in practice.
Make sensor data usable
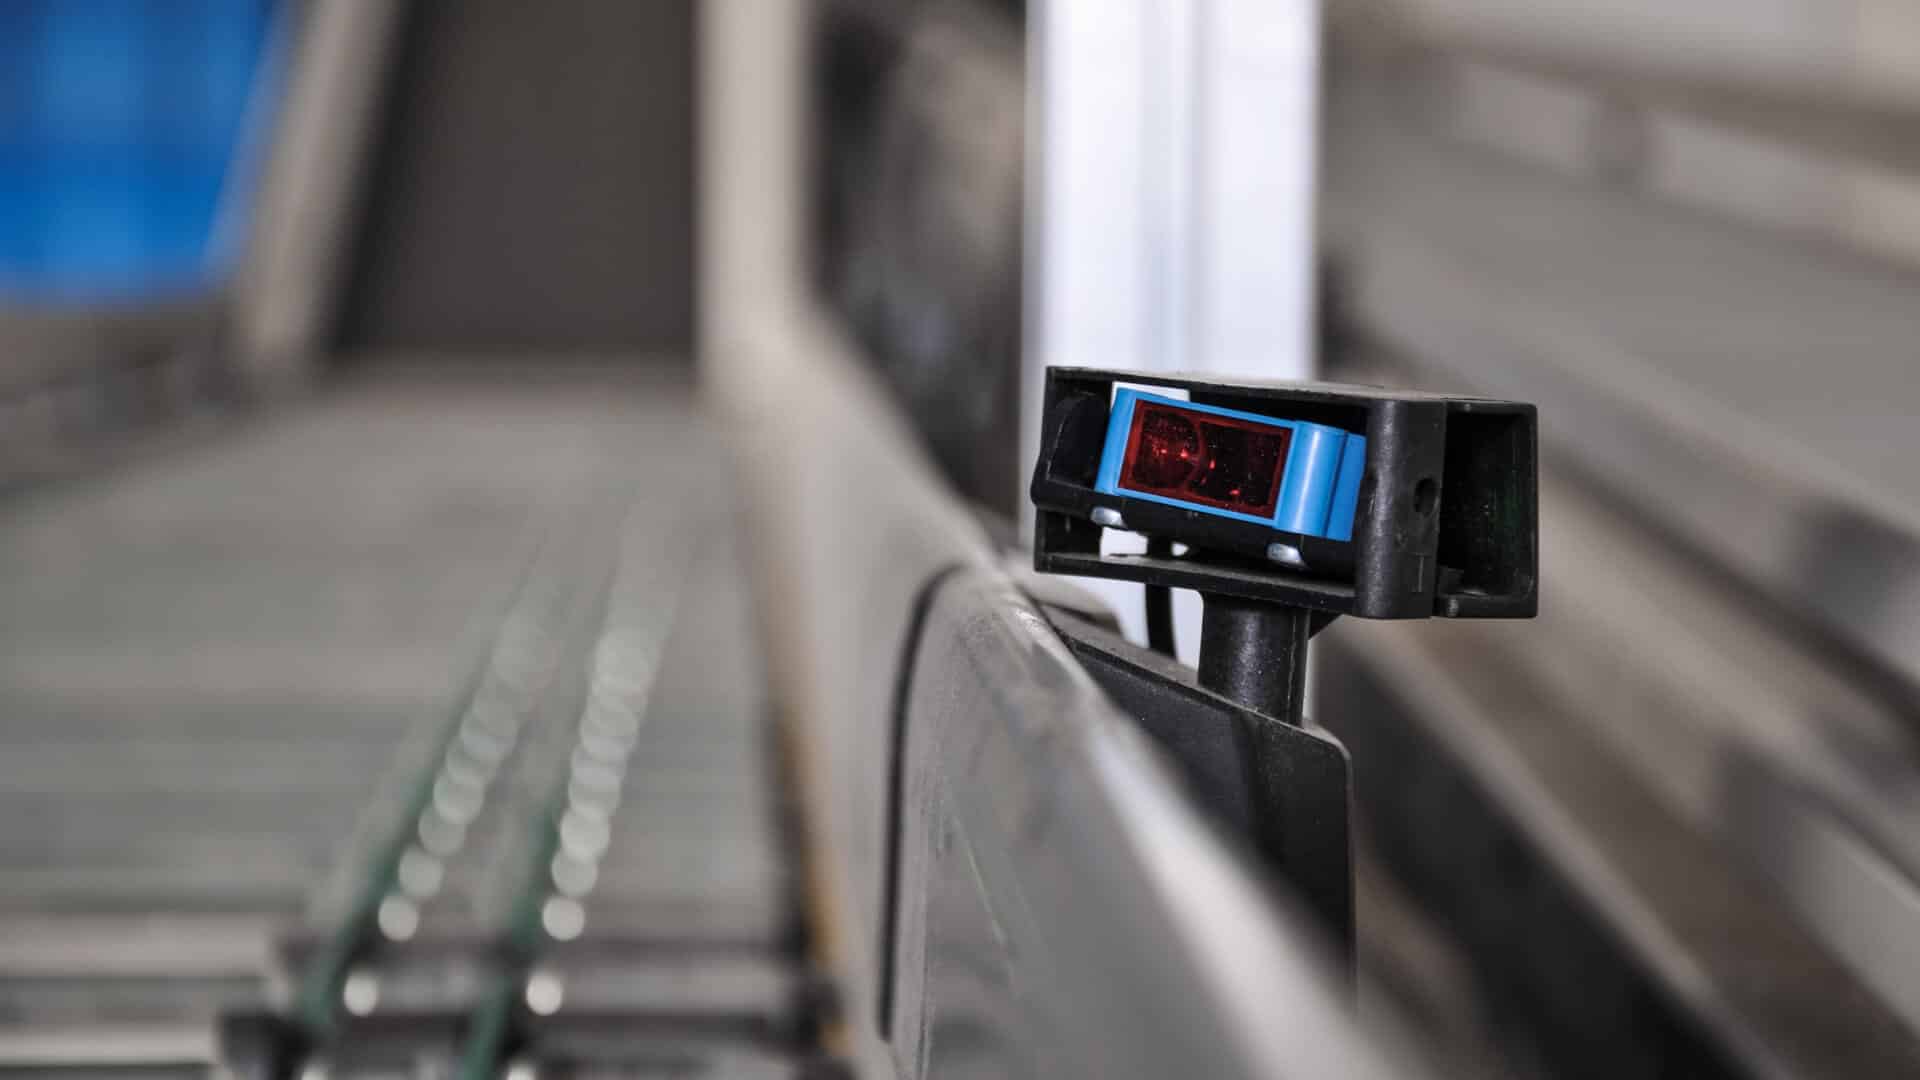
Peakboard can be used to keep an eye on the throughput of a bottling plant at all times and to easily track production progress. A commercially available light barrier is used as a sensor. With our Template The collected data can then be used and communicated in a target/actual comparison. With Peakboard, data from other sources can also be connected and visualized in real time. You can find more use cases in our Templates.
Frequently asked questions about sensors and actuators
What is the difference between a sensor and an actuator?
A sensor measures a physical quantity and converts it into an electrical signal. An actuator does the reverse: it turns a signal into mechanical movement.
Why is sensor data important for production?
Sensor data makes conditions in production measurable and visible. Shown on dashboards, processes can be monitored and controlled transparently.
How is sensor data made usable?
By capturing, connecting and visualising it. Only once the raw data is presented in an understandable way does it raise efficiency.