Query SAP Data Once and Distribute It with Peakboard Hub Flows
With Peakboard Hub Flows, you can query data from SAP once and provide it in a Hub list for any number of Peakboard applications. The ERP system then only has to answer the query from the Hub Flow.
04.11.2026
·
5 min read

- When many Peakboard applications need the same ERP data, a Hub Flow can query it once centrally.
- In the example, the Hub Flow reads the capacity data from SAP every 90 seconds and overwrites a Hub list with it.
- The applications get the data from the Hub list and filter or aggregate it as needed.
- The pattern pays off for source systems that are sensitive to many repeated queries, such as SAP.
The example shows the pattern with the capacity data per workplace.
Part 1 of the series, Historise MQTT Data with Peakboard Hub Flows, covers the basics, from creating a Flow project to monitoring it in Peakboard Hub.
Many applications, the same data
If a plant runs many Peakboard applications that need the same or similar data from the ERP system, such as open deliveries for the loading gates or data for process monitoring, the queries quickly add up. When every application queries the data itself every 30 or 60 seconds, hundreds of applications put a heavy load on the ERP system.
With a Hub Flow, you can query the data once and then distribute it using a hub-and-spoke model. In the example, the Hub Flow reads the data from SAP every 90 seconds and stores it in a Hub list, which keeps it up to date. Each application can then fetch its data from the Hub list asynchronously.
Get the capacity data from SAP
The SAP transaction COOIS provides the capacity data per workplace. In the example, you can select the list “Capacities” with layout 000000000001 and production plant 1000 there. You can save this selection as the variant CAPPERWP and reuse it later in Peakboard. The article SAP COOIS in Peakboard explains how COOIS works.


1. Create the SAP data sources
In Peakboard Designer, you can create a new Flow project and add the SAP data source CapacityPerWorkcenterRaw. Its XQL statement runs the report PPIO_ENTRY with the saved variant:
EXECUTE REPORT 'PPIO_ENTRY' USING 'CAPPERWP'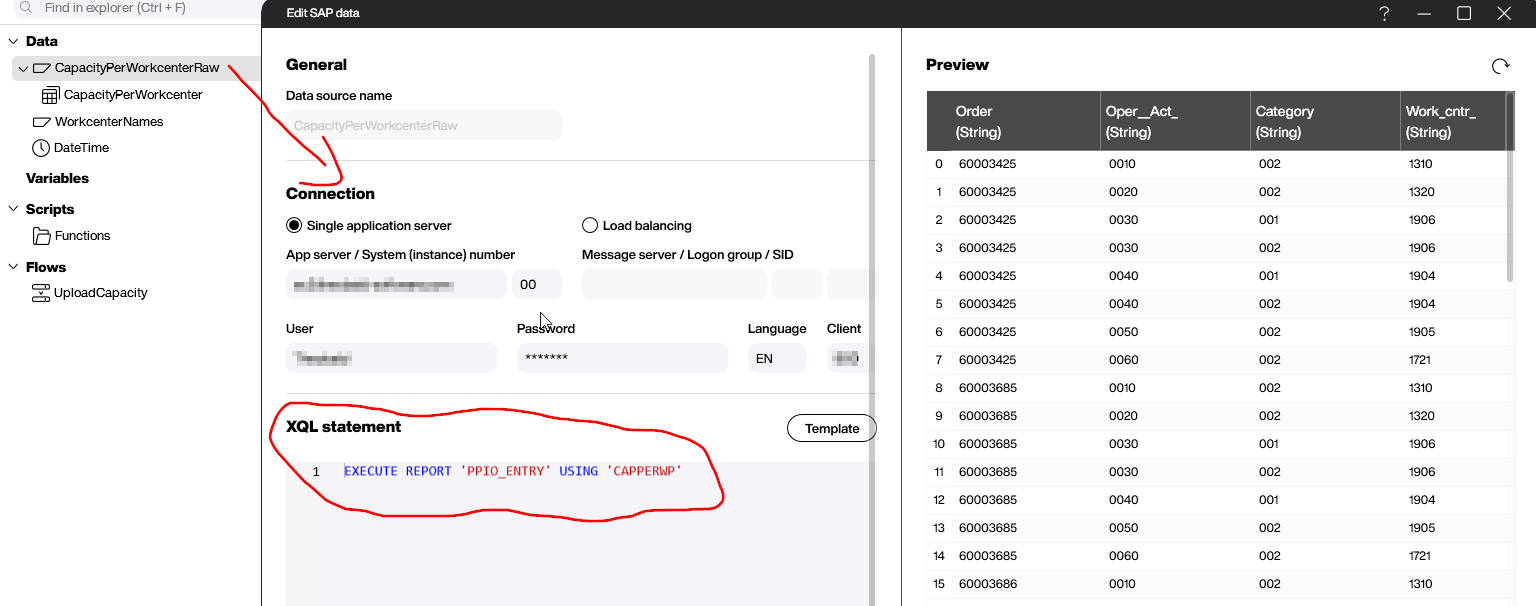
The report returns every operation at every workplace in a plant, but only with the workplace name. You can get the plain-text description with a second SAP data source, WorkcenterNames, which reads the view CRHD_V1. This view contains the description of each workplace in a given language. In the example, the XQL statement reads the English texts for plant 1000:
Select * from CRHD_V1 where spras = 'EN' and werks = '1000'
2. Join the data with a dataflow
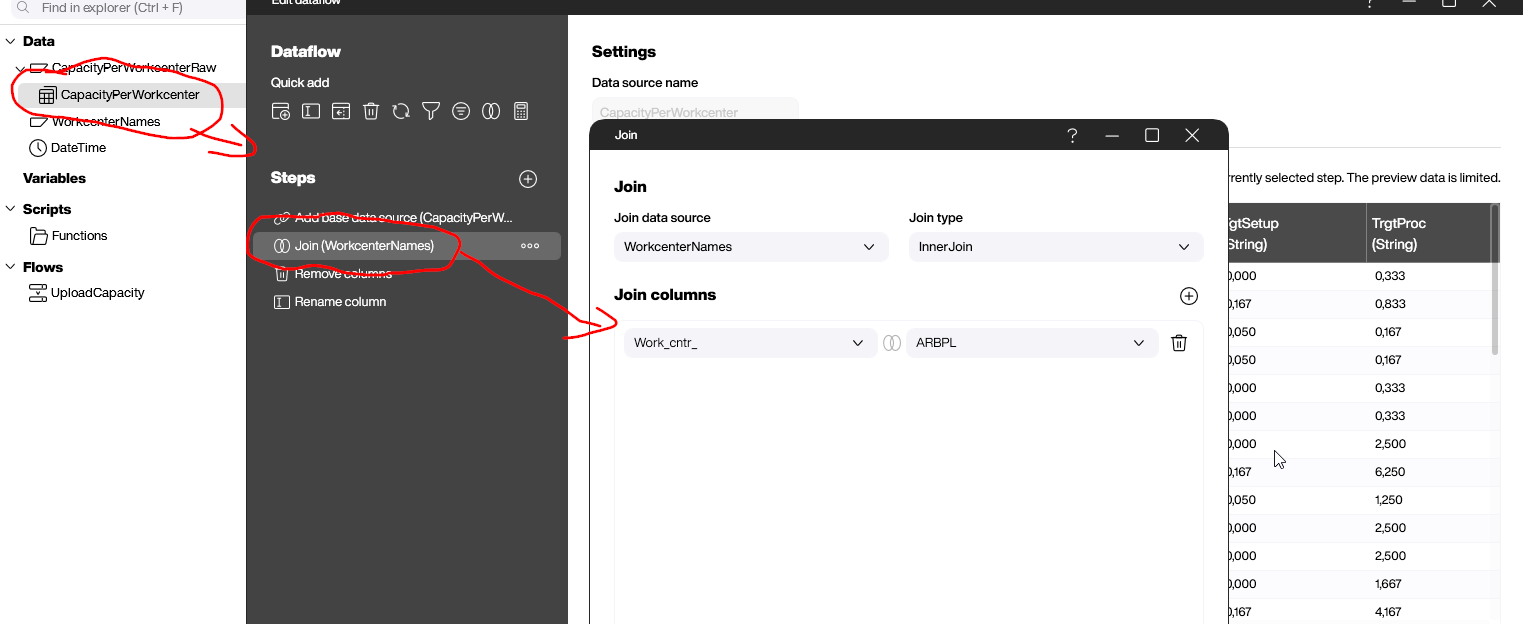
With the dataflow CapacityPerWorkcenter, you can join the COOIS output with the description texts from WorkcenterNames, using the workplace name as the key. In two more steps, you can remove the columns you don’t need and give the rest readable names. For example, Oper__Act_ becomes Operation.
3. Build the Hub Flow
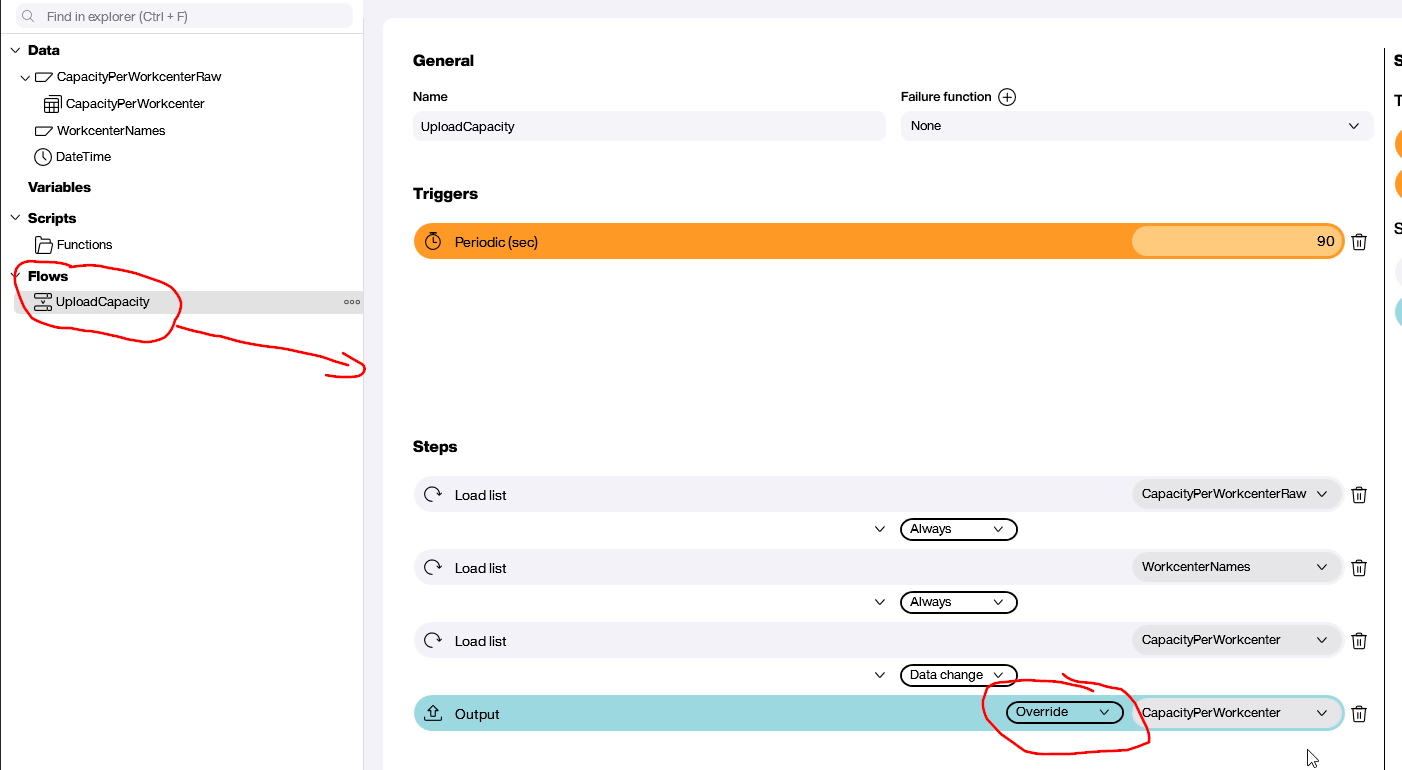
The Hub Flow UploadCapacity puts everything in the right order. With a periodic trigger, you can start it every 90 seconds. These steps follow:
- “Load list” for CapacityPerWorkcenterRaw loads the capacity values from SAP.
- “Load list” for WorkcenterNames loads the workplace descriptions.
- “Load list” for CapacityPerWorkcenter runs the dataflow with the join.
- “Output” in “Override” mode writes the result to an automatically created Hub list.
The “Data change” condition before the output means that this step only runs when the data has changed. In “Override” mode, the content of the Hub list is then replaced completely.
4. Upload and monitor
After the upload, the Hub Flow runs automatically every 90 seconds. In Peakboard Hub, you can follow the status of each step, and the Hub list CapacityPerWorkcenter stays up to date.

Use the data in the applications
In any Peakboard application, you can query the Hub list and prepare the data as needed. For an application at a workplace, you can load the Hub list with a periodic reload every 90 seconds and use an advanced filter to show only that workplace, in the example Workcenter == 1904.

A plant overview application does not need every single operation. There, you can use a dataflow to change the data type of the RemProc column to Number, sum its values and group them by WorkcenterText, which gives you one value per workplace.

As long as the Hub Flow refreshes the raw data regularly, you can reuse it in any application. The pattern is especially worthwhile for source systems like SAP that are sensitive to many repeated queries.
Further reading
You can download the Flow project SAPWorkplaceCapacityUpload.pbfx and open it in Peakboard Designer. The SAP data connection page explains how to connect SAP in Peakboard Designer.
Free trial
Try Peakboard Hub for free
Hub Flows are included without limits in the 60-day Peakboard Hub trial, so you can rebuild the example from this article right away.

Why use a Hub Flow for SAP data?
If many applications query the same data individually every 30 or 60 seconds, the ERP system comes under heavy load. With a Hub Flow, only the Hub Flow accesses SAP, and all applications read from the Hub list.
How often does the Hub Flow query SAP in the example?
Every 90 seconds. It runs both SAP data sources and the dataflow and overwrites the Hub list with the result as soon as the data has changed.
Which SAP objects does the example use?
The report PPIO_ENTRY with the saved COOIS variant CAPPERWP for the capacities and the view CRHD_V1 for the workplace descriptions.
Can the applications prepare the data differently?
Yes. For an application at a workplace, you can filter the data by that workplace, and for a plant overview, you can sum the values per workplace.
How does the data in the applications stay up to date?
Every 90 seconds, the Hub Flow overwrites the Hub list in “Override” mode as soon as the data has changed. In the applications, you can load the Hub list with a periodic reload, also every 90 seconds in the example.