
How binder makes SAP and non-SAP data usable in real time with Peakboard
Franz Binder GmbH & Co. Elektrische Bauelemente KG
challenges
Visualization of SAP and non-SAP data and provision on the shop floor for greater transparency in logistics processes
solution
Use of four Peakboard Boxes for data visualization via monitors at various points in the company, connection of SAP EWM, Siemens S7, and Office, development and provision of 4 layouts for logistics employees, control center
benefits
- Visualize SAP and non-SAP data in near real time
- Transparency about logistics processes at the point of use
- Faster response times and optimized work distribution through targeted data provision
- Continuous process improvement
Time to Value
binder is one of the leading specialists for circular connectors. Founded in 1960, the company develops, designs and manufactures customer-specific solutions for industries such as automation, smart communication, medical technology and many more. The binder Group includes headquarters, nine international sales offices, seven production sites, two system service providers and an innovation and technology center. The company employs around 2,000 people worldwide.
At the production site in Neckarsulm, connectors are manufactured with a variety of manufacturing methods, from manual to semi-automated to diverse, fully automated assembly — logistically connected via a state-of-the-art automated high-bay warehouse as a vertical backbone. The logistics processes are mapped via SAP EWM (Extended Warehouse Management) and SAP EWM/MFS (material flow system); SAP S4/HANA is used as a platform.

"Peakboard enables us to pragmatically implement digitization with minimal IT effort. The solution is intuitive to use, can be flexibly developed internally and ensures noticeable efficiency gains in our processes through transparent data provision. Our employees benefit from improved availability of information — and we as a company benefit from higher productivity and faster response times."
Complex logistics processes
As a company with a high level of vertical integration and diverse production processes, binder was faced with the challenge of efficiently managing the growing complexity and dynamics in manufacturing. One central concern was to inform employees quickly, specifically and, as far as possible, in real time about relevant key figures such as plant utilization, current workload, order backlog and any process deviations.
However, manually evaluating the required data from SAP proved to be time-consuming and not very practical, explains Götz Nussbaum, Head of Logistics at binder:
“With the introduction of an automated high-bay warehouse, employees no longer had the usual opportunity to visually assess the current order load. In the past, they could tell from the piles of paper how much work they had to do. Digitalization initially lacked a suitable tool for visualizing the relevant live data from the system. ”
Many users were also unfamiliar with the classic SAP interface (SAP GUI) — which made operation difficult and significantly limited transparency in everyday work.
“To get the information you need from SAP, you have to click through numerous transactions, select the appropriate variant and much more,” adds René Spranger, team leader Strategic Logistics at binder. “But we don't want to spend time searching for data — we want to use information quickly, clearly and as close to real-time as possible to improve our logistics processes in a targeted manner. ”
Since binder plans in a future-oriented manner, a solution was also required that was not limited to SAP but could also integrate data from non-SAP systems — which ruled out SAP Fiori as an option. At the same time, the solution should be able to be maintained and developed internally, without external support and high running costs. The development of appropriate SAP masks alone would have required investments of 15,000 to 20,000 euros — subsequent adjustments would have resulted in additional expenses.
Low-code visualization with Peakboard
“We set out to find a provider who could connect a variety of data sources — including SAP — in real time and at the same time offer a solution that we as a department could design independently and continuously develop,” reports Götz Nussbaum.
With Peakboard, binder opted for a low-code platform that is specifically tailored to the needs of industrial companies. Peakboard is SAP-certified. This ensures a stable and seamless connection of Peakboard to SAP data sources without the need for additional middleware.
Peakboard makes it possible to create individual dashboards and industrial applications within a very short period of time — without in-depth IT knowledge or lengthy implementation projects. The seamless connection to existing IT and machine landscapes allows data from SAP and non-SAP systems, such as machine controls, sensors or office applications, to be centrally bundled and clearly presented.
“An additional advantage for us was that Peakboard is also a medium-sized company from the region,” adds René Spranger. “Short distances, direct communication and quick decisions — that fits very well with our philosophy as a family business. ”
Quick integration and independent development
The project kicked off with an initial in-house workshop.
“Based on our marketing CI, we have developed two different visualizations for three Peakboard Boxes — each adapted to the area of application: Level 0 for incoming goods and outgoing customer goods, and level 2 for production supply and incoming goods. Relevant live data from the SAP system, fault messages and the workload of picking workstations are thus visible to all employees in a transparent and graphical format,” explains Götz Nussbaum.
Various data sources were connected, including SAP EWM, SAP EWM/MFS, office applications such as Excel and Outlook, and Siemens-S7 plant technology control. Peakboard runs entirely on the company's own network — this means that all sensitive production data in the company remains protected and the highest IT security standards are guaranteed.
The Peakboard help page on the Internet also proved to be very helpful with regard to the independent development of the solution requested by binder: “I simply find everything there,” says René Spranger.
The collaboration with Peakboard was also rated particularly positively. Once there was feedback on customer service, managing director Patrick Theobald personally made the issue a top priority and, together with binder, quickly found suitable solutions.
“This direct, solution-oriented communication is extremely valuable to us as a medium-sized company — and it still works excellently today. If we do need support, we get it directly, without detours via an anonymous call center,” says René Spranger.

Real-time information for better decisions on the shop floor
“We use visualization with Peakboard in the logistics sector both in order picking and in production supply,” says Götz Nussbaum. “Other fields of application include control via the control center and in the area of maintenance. ”
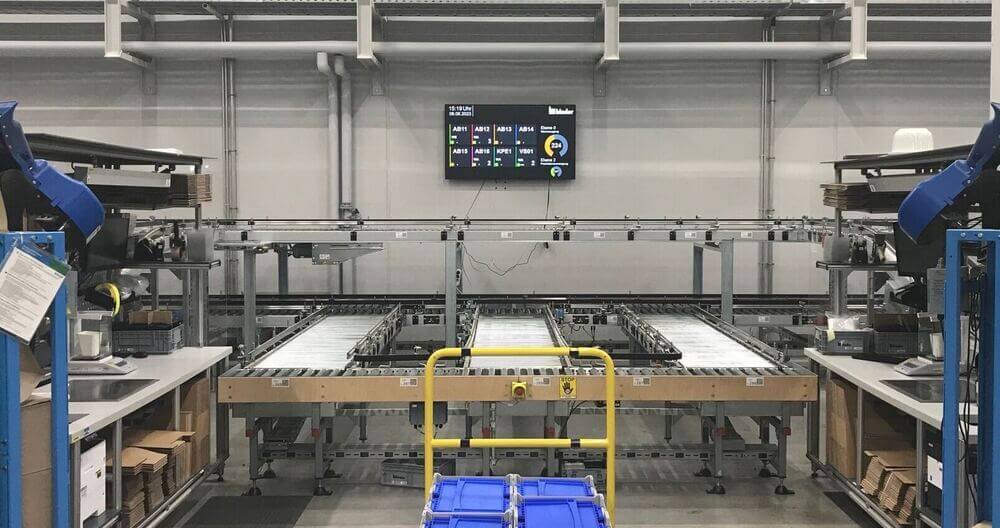
Four Peakboard boxes are currently in use. Large-format 65-inch screens in the logistics hall and control center are used to visualize all relevant information in real time — directly and clearly on the shop floor. As a result, around 40 employees always have a quick overview of open deliveries (broken down by load carrier type), the status and worklist of individual workstations, the current number of outgoing goods and the status of supplied production orders or units.
Order progress, machine status, quality indicators and current faults are also displayed. System events such as workplace demolitions or error messages can be shown or hidden in a targeted manner as required. Consistent transparency enables teams to react more quickly to deviations, avoid downtimes and initiate continuous improvements directly. “If an employee sees on the dashboard that, for example, outgoing goods is significantly more busy than incoming goods, they can independently change jobs and provide support at the level where there is currently more demand,” explains René Spranger.
In addition, the solution also supports cross-team communication: “Depending on the situation, the control center also passes on the information to other areas, such as sales — for example when it becomes apparent that delivery could be delayed due to a malfunction,” adds René Spranger.
“As a result, our customers benefit from greater transparency and are informed of delays at an early stage. This makes it possible to plan delivery dates more reliably, which stabilizes processes on the customer side and increases satisfaction. ”
New dashboards for quality management, leadership and control center in planning
According to Götz Nussbaum, further Peakboard applications are already being planned and implemented. :
“The existing layouts are constantly being developed to meet increasing requirements and increasing complexity. In addition, the technology is increasingly being used in other areas of the company — for example in quality management or to visualize key performance indicators in production. A management summary for current KPI evaluations is also being planned. Thanks to the ability to design the screens independently, there are virtually no limits to the possible applications. ”
Productivity increased, processes accelerated, personal responsibility strengthened
With Peakboard, binder was able to significantly improve transparency in logistics processes. Employees always have an overview of their own progress and the current workload in the team. This allows them to provide targeted support — for example by changing jobs — and actively contribute to optimization. This not only promotes personal responsibility, but also a willingness to help one another. Work is distributed more efficiently because everyone can see where support is needed right now.
“The visualizations create information and transparency for employees and at the same time strengthen personal responsibility by making work progress visible. Complex dependencies can thus be presented graphically in a simple and understandable way,” summarizes René Spranger.
The reaction speed has also increased: Employees receive exactly the information that is relevant to their respective workplace in almost real time — for example about the current workload or the workload. In contrast to SAP, where all data from all workstations is loaded with every query and then your own workstation must be manually selected, Peakboard provides the required information in a targeted manner and almost in real time. Even with deliveries, the time-consuming selection from extensive data sets is no longer necessary. Instead of an active search, the required SAP data is automatically displayed and is available at any time — saving time and increasing efficiency in everyday work.
Peakboard also offers helpful functions for operational work, such as the conversion of quantities into standardized load units such as KLTs. An employee sees at a glance that, for example, 45 KLT3 and 60 KLT4 still need to be stored — a transparent overview that not only promotes personal responsibility, but also contributes to self-discipline in everyday working life.
The quick integration and easy customization of the dashboards make it possible to flexibly implement new requirements or process changes — without external support or long waiting times.
The investment in Peakboard has paid off for binder in several ways: Productivity has been increased, response times to faults have been significantly reduced and the basis for continuous improvement of processes has been created. Thanks to the intuitive user interface, layouts can be flexibly adapted or completely redesigned. Even complex logics can be created independently and integrated directly into the visualization. In addition, the costs for implementation and ongoing operation were significantly reduced compared to traditional IT solutions, as hardware, updates and support are already included in the scope of services.
By using Peakboard, binder has taken an important step towards a smart factory. The solution links live data from all relevant systems, visualizes it in real time and supports the automation of processes. René Spranger has a valuable tip for future Peakboard users:
“The best ideas and requirements for new dashboards come from the specialist departments — after all, employees know the processes best. This is particularly helpful when people with a bit of IT affinity are involved. This is because Peakboard is so intuitive that you can quickly develop your own, practical solutions even without in-depth IT knowledge. The IT department remains an important partner, but is moving more into a supporting role. ”
“Looking back, I would recommend involving several specialist departments at an early stage and making the solution visible across the company,” concludes René Spranger. “As a result, the benefits are perceived more strongly — today we can see how much interest there is from other areas that are very positive about our solution. ”
Start now with Peakboard and simplify your processes
Turn live data into smart decisions with Peakboard.
