Data connection with
Beckhoff
- Direct connection: Connect Beckhoff TwinCAT 3 PLC without detours
- Real-Time Dashboards: View, understand and react instantly to live data
- Flexibly expandable: Can be combined with SAP, OPC UA, MES & more


Seamless connection to Beckhoff PLC
With Peakboard, you connect your Beckhoff PLC (e.g. TwinCAT 3) directly and without detours. With the Peakboard Designer, you select specific variables from your controller, filter and visualize them — live and in real time. You can not only read data, but also write it back, for example, to confirm or interactively control machine processes.
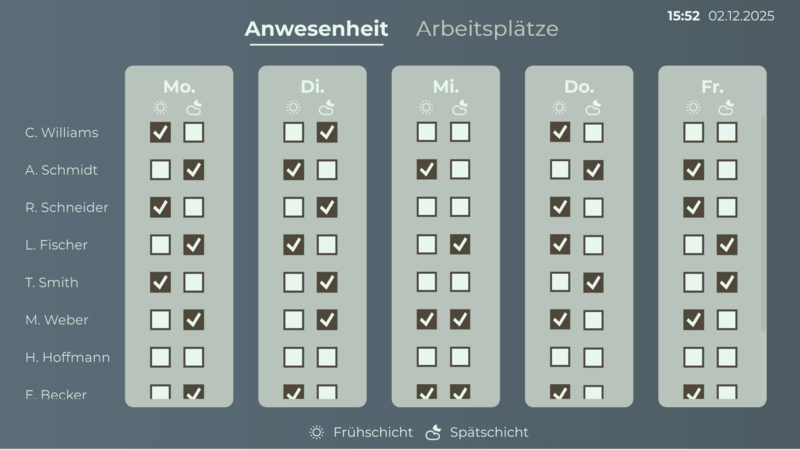
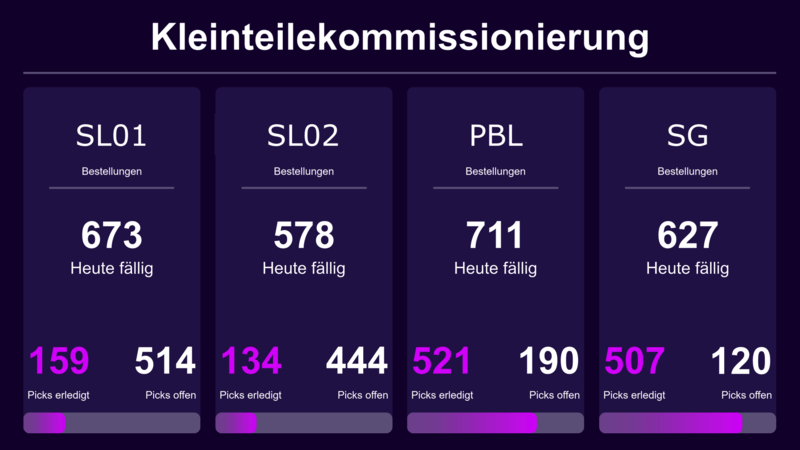
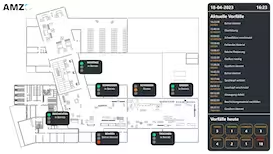
Design interactive dashboards and HMIs
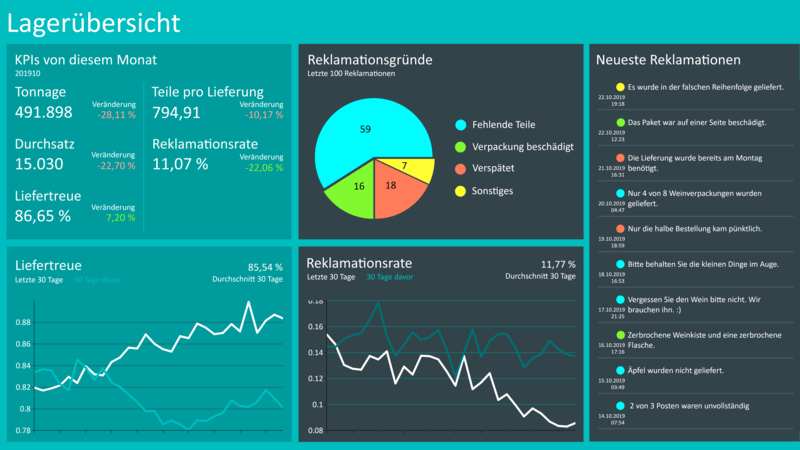
Peakboard is much more than just a display platform: It is a full-fledged HMI solution, which can be flexibly adapted to your specific requirements — without complex programming. Using the intuitive user interface in Peakboard Designer, you can design dashboards or industrial apps that are not only visually convincing, but also functionally represent exactly what is relevant for your production.
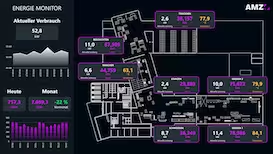
Whether OEE values, current machine states, meter readings or fault reports — all information can be visualized in real time and brought into a user-friendly layout. With interactive controls such as buttons, switchers, dropdowns or touch inputs, you can control processes directly from the display — ideal for decentralized decisions on the shop floor.
You can also define role-based views, for example for production, maintenance, or quality management. In this way, every target group sees exactly what is important to them — nothing more and nothing less. The design is completely customizable: colors, icons, charts and animations can be adapted to your corporate design or the respective application.
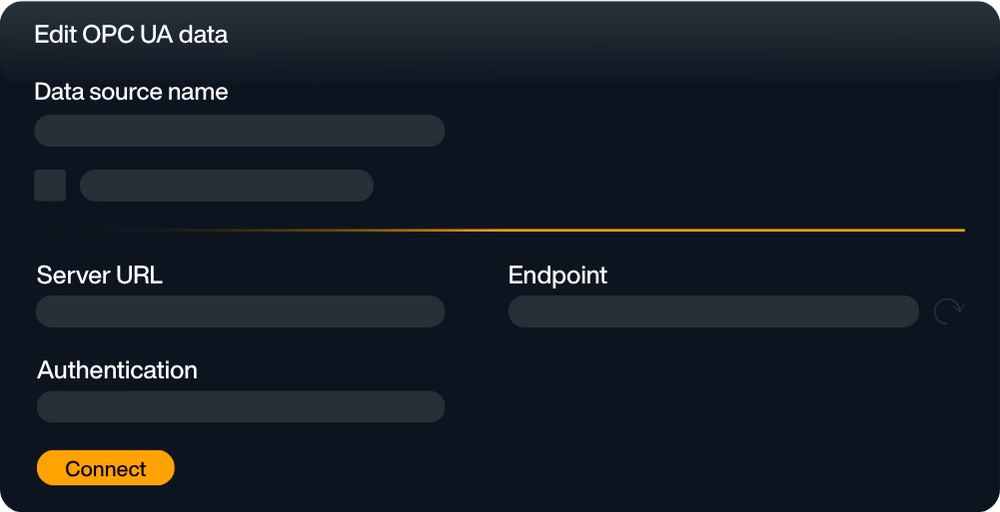
Combine Beckhoff data with other sources
Do you want to display more than just your PLC data? No problem: Peakboard allows you to connect data from Beckhoff controllers with other systems — e.g. from SAP, your MES, OPC UA, SQL or IoT platforms. This creates a comprehensive overview of your production landscape that breaks down silos and supports decisions.
Peakboard as an HMI alternative
With the integrated Building Blocks Function, you build your individual HMI — completely without classic SCADA engineering. Peakboard works directly on the edge, does not require a central server structure and is ready for use in no time. Ideal for production areas where rapid visualizations and high flexibility are required.
Easily configured, instantly productive
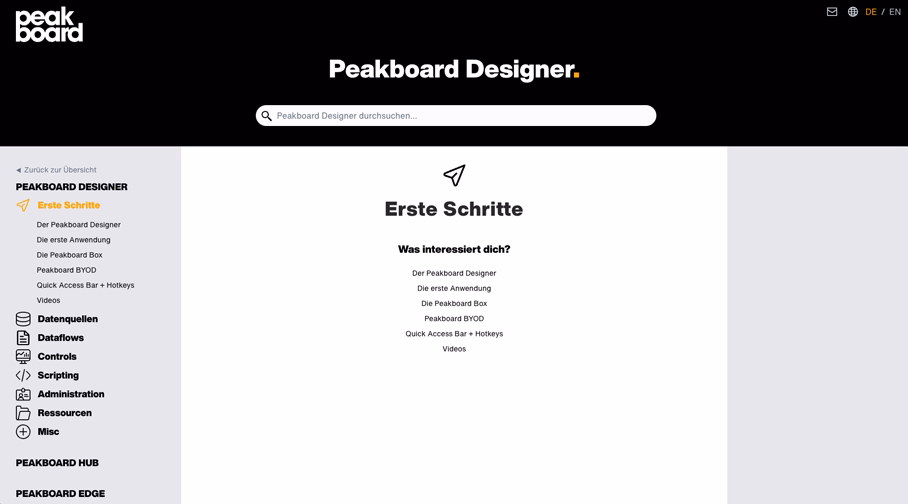
Setup is quick and requires no programming. In just a few minutes, your Beckhoff controller is connected and your first dashboard is created. Peakboard fits seamlessly into your existing automation environment — bringing maximum overview and interactivity to the screen.
Start now for free with Peakboard Designer
Capture, process and visualize production and order data in real time — simply and without programming knowledge.


All of your data.
Peakboard connects your systems and brings all data to one platform — for visualization, automation and individual applications.


%201.svg)


%201.svg)


More information
for your start with Peakboard.

Save time with our templates
No time for long designs? No problem: Use one of the many ready-made templates for dashboards and applications — e.g. for production monitoring, warehouse management or quality assurance. Pick a template, customize it, and you're done.