DISPLAYS ON SITE
1 Display
EMPLOYEES
18
Data sources


1 License
One license per display

The interactive Ishikawa diagram from Peakboard makes the possible causes of a fault or a recurring problem visible – sorted by Manpower, Machine, Material, Method, Measurement, and Environment. The team creates a new problem or selects an existing analysis and adds causes step by step, right on the board. Every analysis is saved and can be opened again later.


Causes are collected in the meeting, but there is no way to look them up later.
The discussion focuses on the most obvious cause, and other factors remain unconsidered.
When the problem comes back, the search for causes is run through again from the start.

Native SAP connector, OPC UA, MQTT, and dozens of other sources are available out-of-the-box. You just connect, instead of integrating – and the data appears directly at the shop floor.


%201.svg)


%201.svg)


An extra category, another input field, your own layout – with drag-and-drop in the Peakboard Designer and Peakbot, you adapt the board yourself, no coding skills required.
Whether on the Peakboard Box or your own hardware – both run 100% on-prem, with no single point of failure and no cloud dependency.
Device-based pricing instead of user-based licenses: one license per display, unlimited users per device. More staff on the same display cost nothing extra.



Introducing a digital fishbone diagram shouldn't take a year. With Peakboard, you start right away – no appointment, no major IT project.


Start Immediately · No Appointment · Free
If you need support: You'll find tutorials and step-by-step guides on our Helpsite and our YouTube channel. For individual needs, we offer workshops and consulting.
In conversation · With experts · 55 min.
Discuss your specific use case with an expert – briefly provide information about your use case beforehand, and we'll get straight to the point.
You'll get a complete overview of all features and see what's possible with Peakboard in your environment.

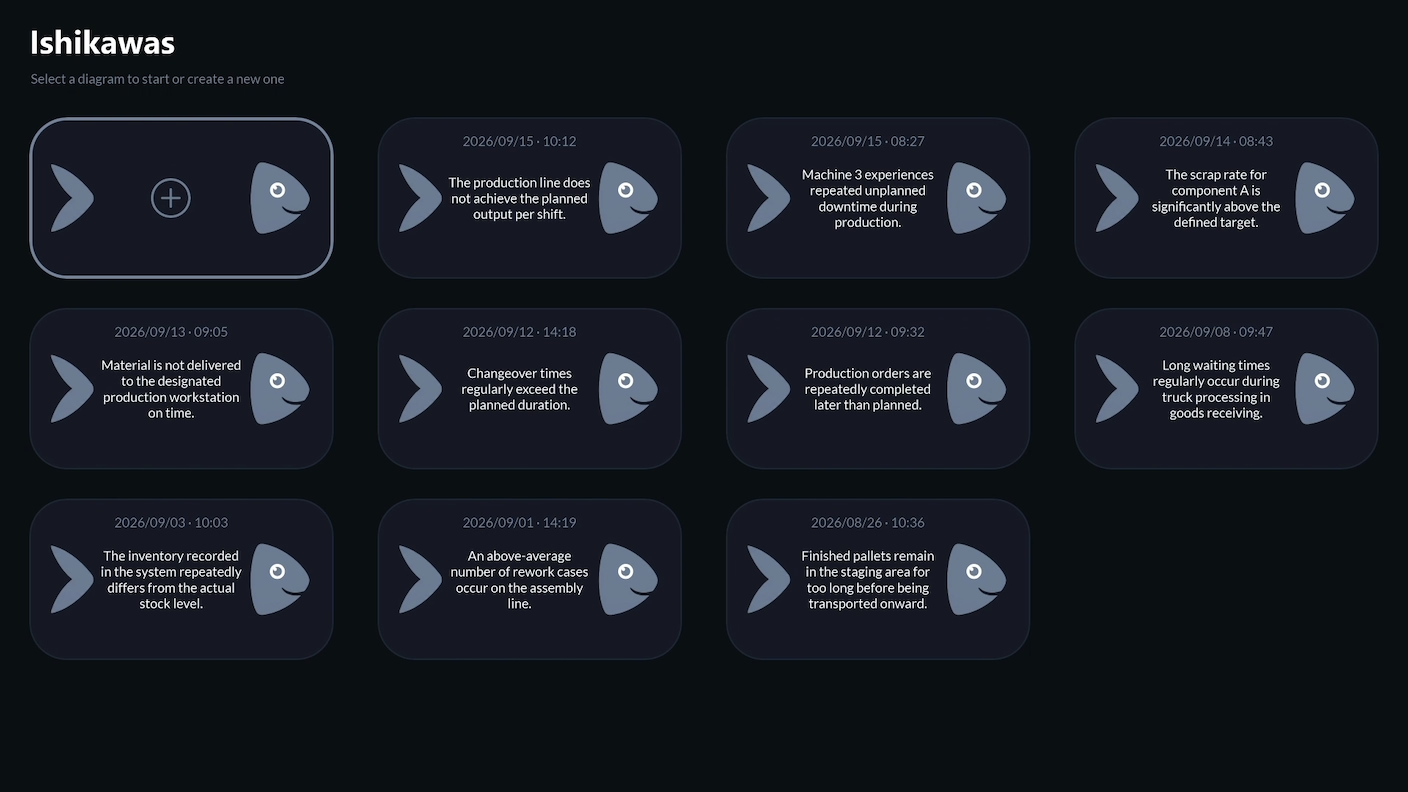
The overview shows all saved Ishikawa diagrams with date, time, and problem statement. A new diagram starts with the question of where the problem lies. Then a category is selected, the cause typed in, and added to the diagram with a click – it appears on the matching branch, with the problem at the head. In the template, problem statements and causes are stored in lists in the Peakboard Hub, so every analysis is kept. Other data sources such as SQL, Oracle, or ODBC can be connected just as well.
To trace a single cause step by step down to its core, the digital 5 Whys analysis is the right fit.
The Ishikawa diagram, also known as a fishbone diagram, is an established quality management method that is also firmly rooted in Lean Management. It makes the potential causes of a problem visible so the team can evaluate them together and derive the necessary corrective actions. The problem sits at the head of the diagram; the potential causes are assigned to categories.
For disruptions, quality deviations, process issues, and recurring errors. An initially broad problem turns into a clear cause analysis, helping your team identify relationships more quickly and discuss potential root causes in a focused way.
The six classic categories Manpower, Machine, Material, Method, Measurement, and Environment. You assign each potential cause to one of them.
You start a new diagram from the overview and describe the problem. Then you select a category, enter the cause, and add it. It appears right away on the matching branch of the diagram.
Yes. The overview shows all saved diagrams with date and problem statement. You select an analysis and add further causes step by step.
The board holds the potential causes; your team decides on the countermeasures. Who does what by when can be tracked in the shopfloor team meeting board, for example.
That's your choice. In the template, problem statements and causes are stored in lists in the Peakboard Hub, which comes as an online and an on-premises edition. Other data sources such as SQL, Oracle, or ODBC can be connected just as well.
Yes. You change categories, input fields, and layout by drag-and-drop in the Peakboard Designer, no coding skills required.