DISPLAYS ON SITE
1 Display
EMPLOYEES
18
Data sources


1 License
One license per display

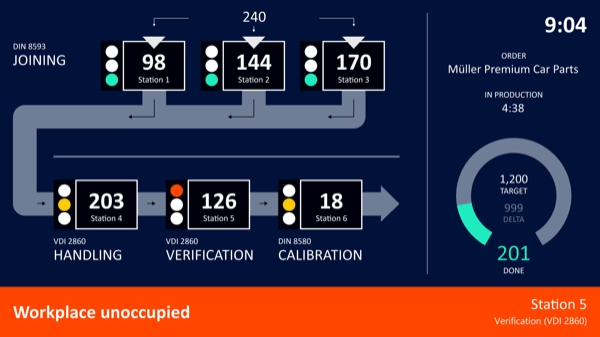
With Peakboard you pull plant data from SCADA, PLCs, and sensors—and show machine status, limit values, and faults in real time on a display on the shop floor. Straight from OPC UA, Siemens S7, MQTT, or Modbus, with no programming knowledge.
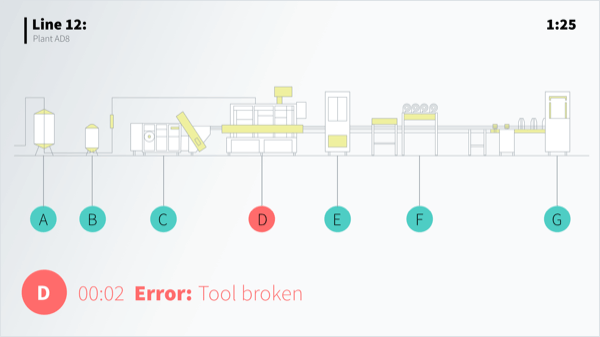


The plant data sits in the control room—nobody sees it at the line.
Limit violations end up in a log—the response comes too late.
Process values and order data live in separate systems—merging them by hand costs time and invites mistakes.
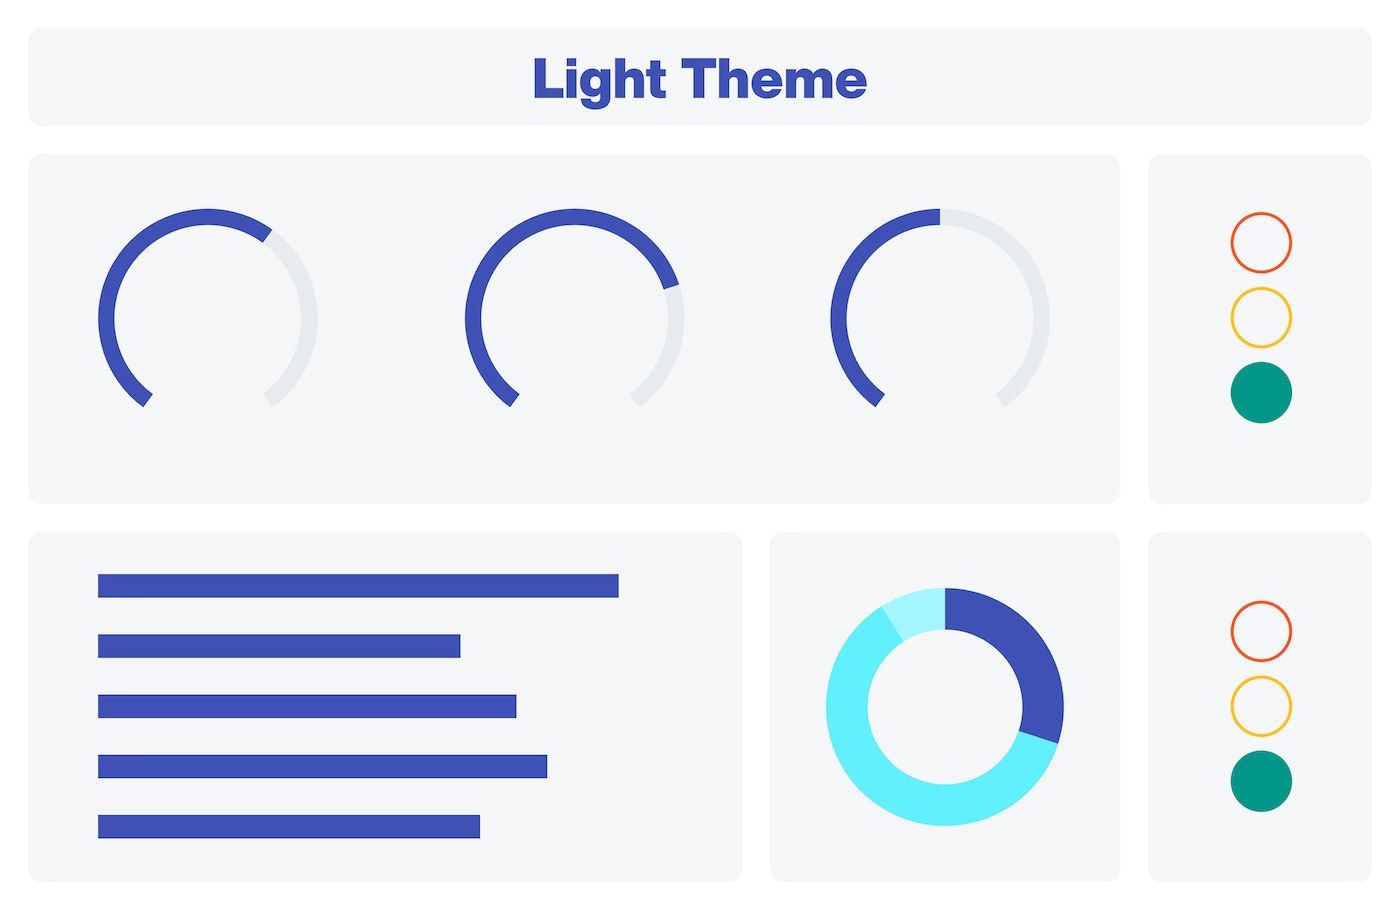
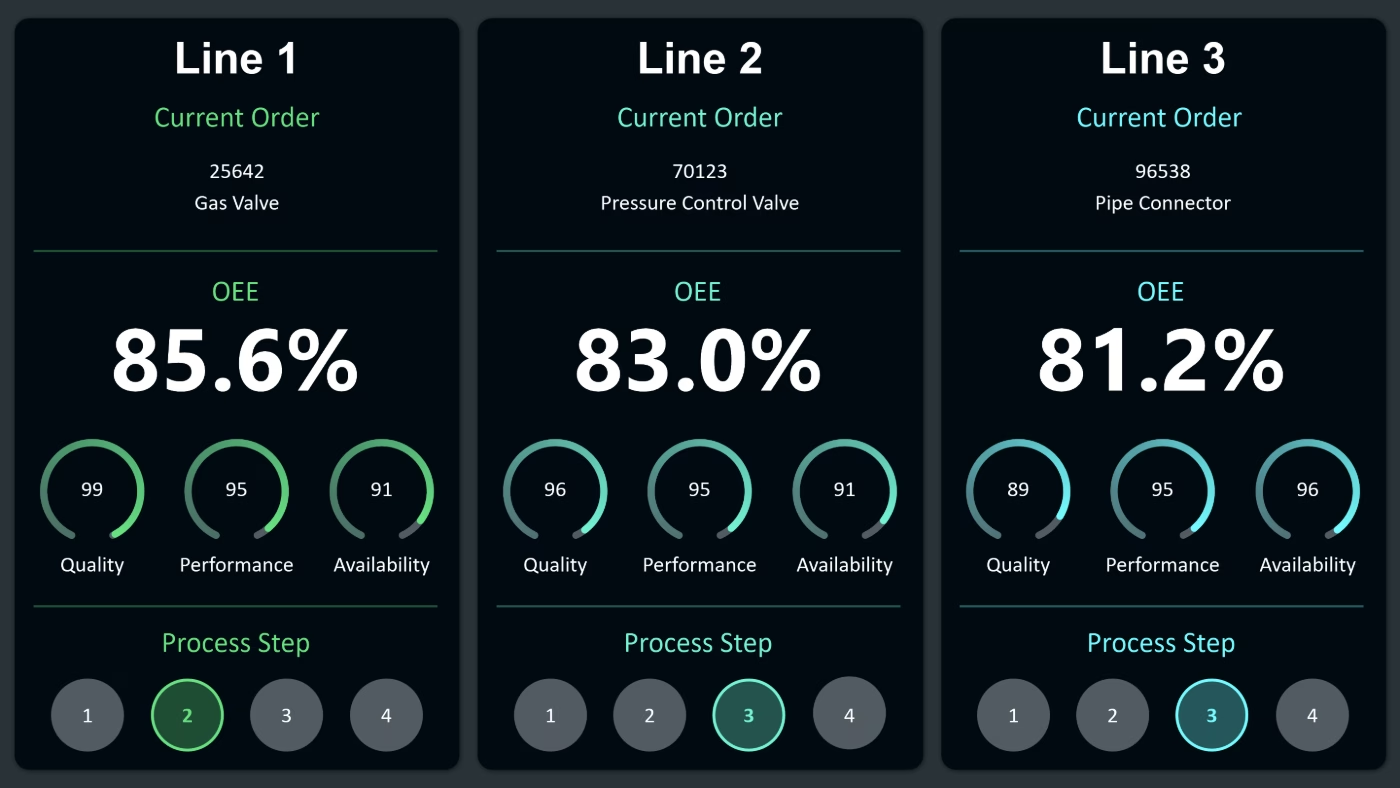
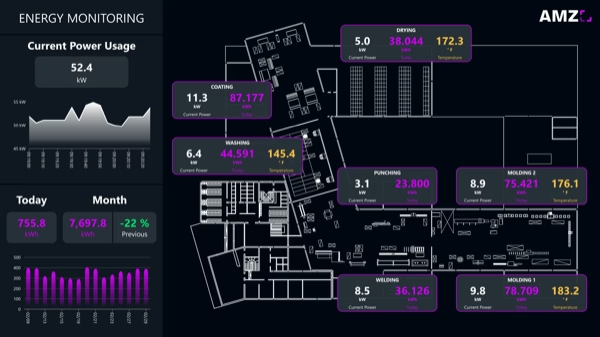
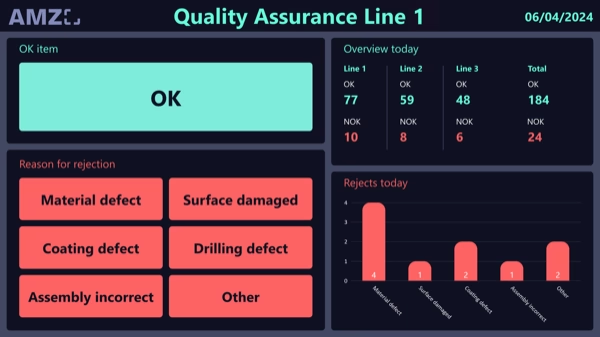
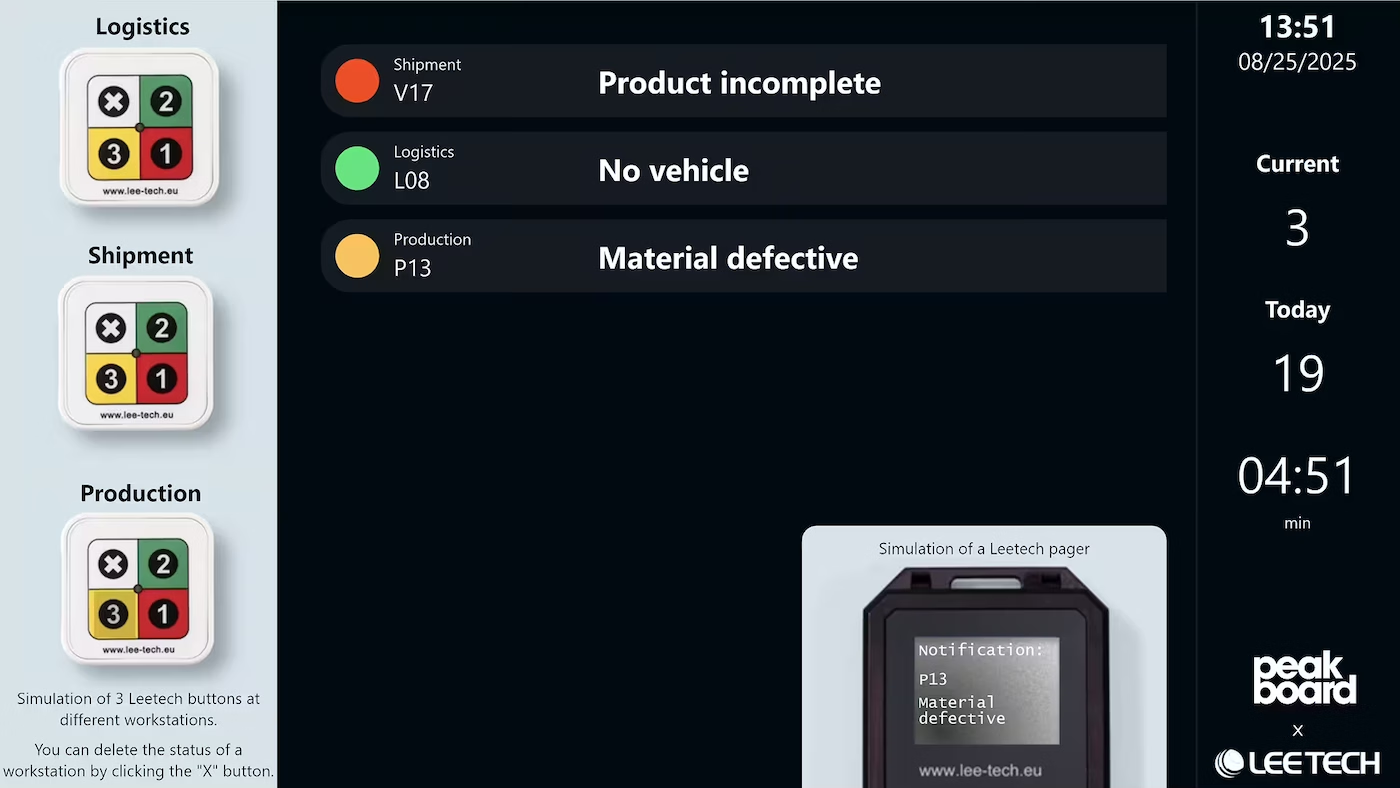
The template shows every asset in one real-time view – measured values, limits, and operating states at a glance, straight from the systems you already run.
Native SAP connector, OPC UA, MQTT, and dozens of other sources are available out-of-the-box. You just connect, instead of integrating – and the data appears directly at the shop floor.


%201.svg)


%201.svg)


A new asset, a different alarm level, an extra data source – thanks to the low-code editor and Peakbot, business teams can customize the visualization themselves, no coding skills required.
Whether on the Peakboard Box or your own hardware – both run 100% on-premises, with no single point of failure and no cloud dependency.
Device-based pricing instead of user-based licenses: one license per display, unlimited users per device. More employees on the same display cost nothing extra.



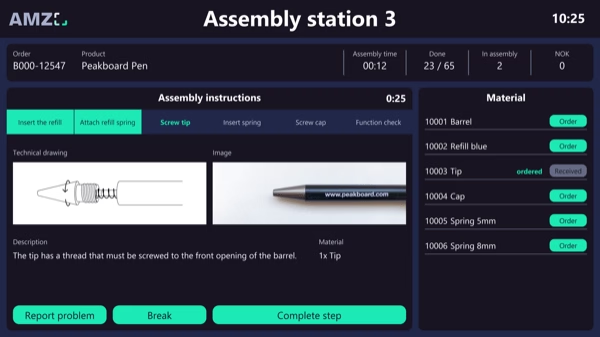
Rolling out a plant visualization shouldn't take a year. With Peakboard, you start right away – no appointment, no major IT project.
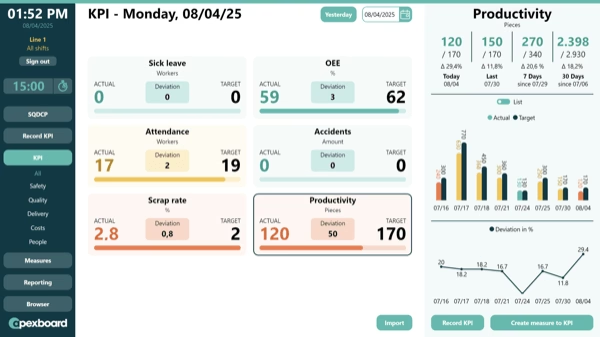
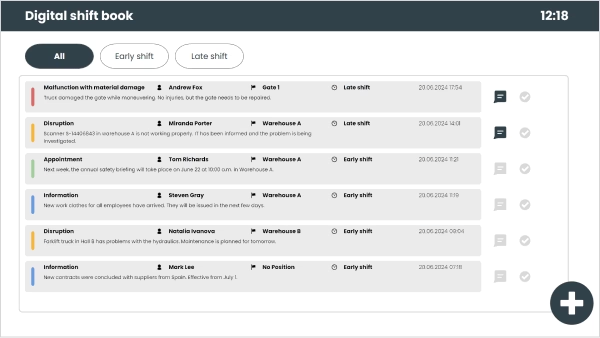
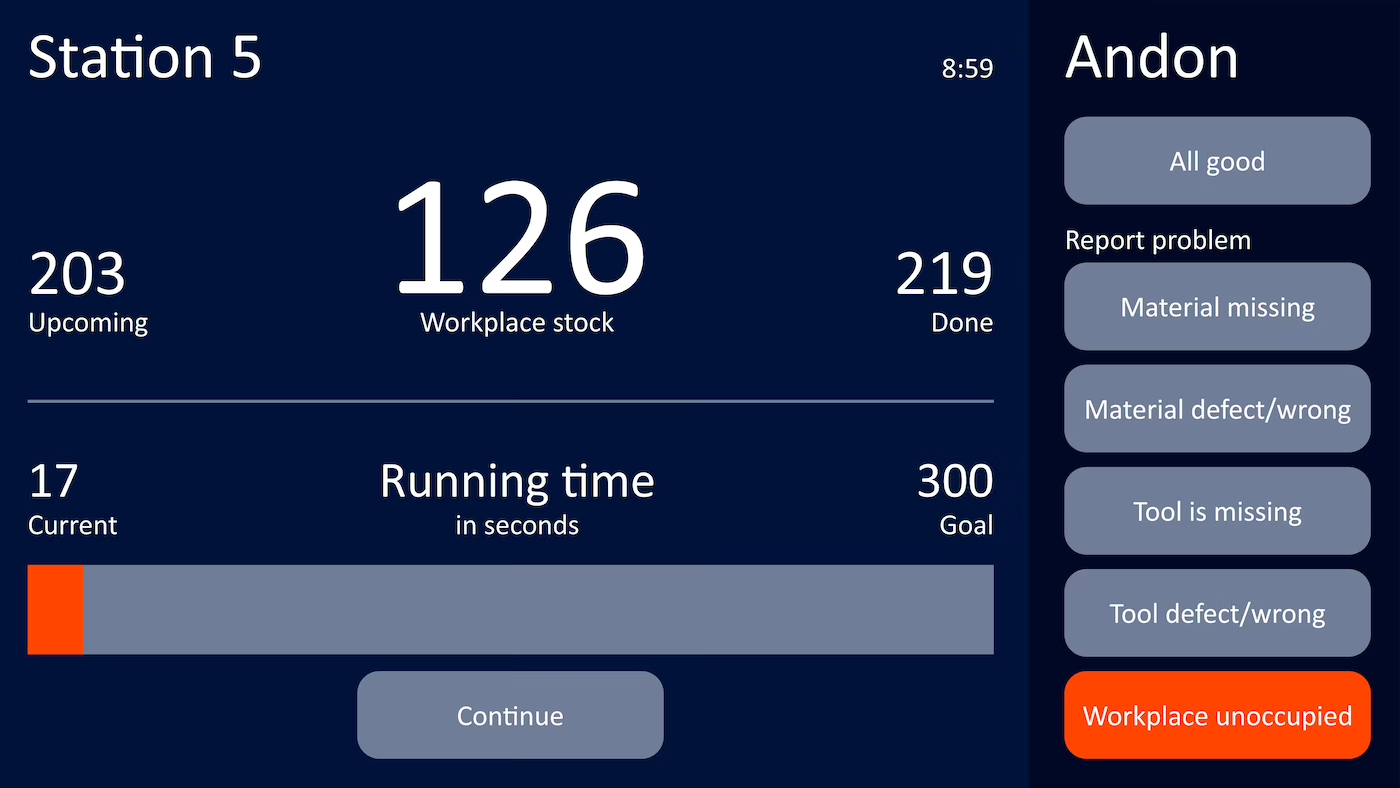

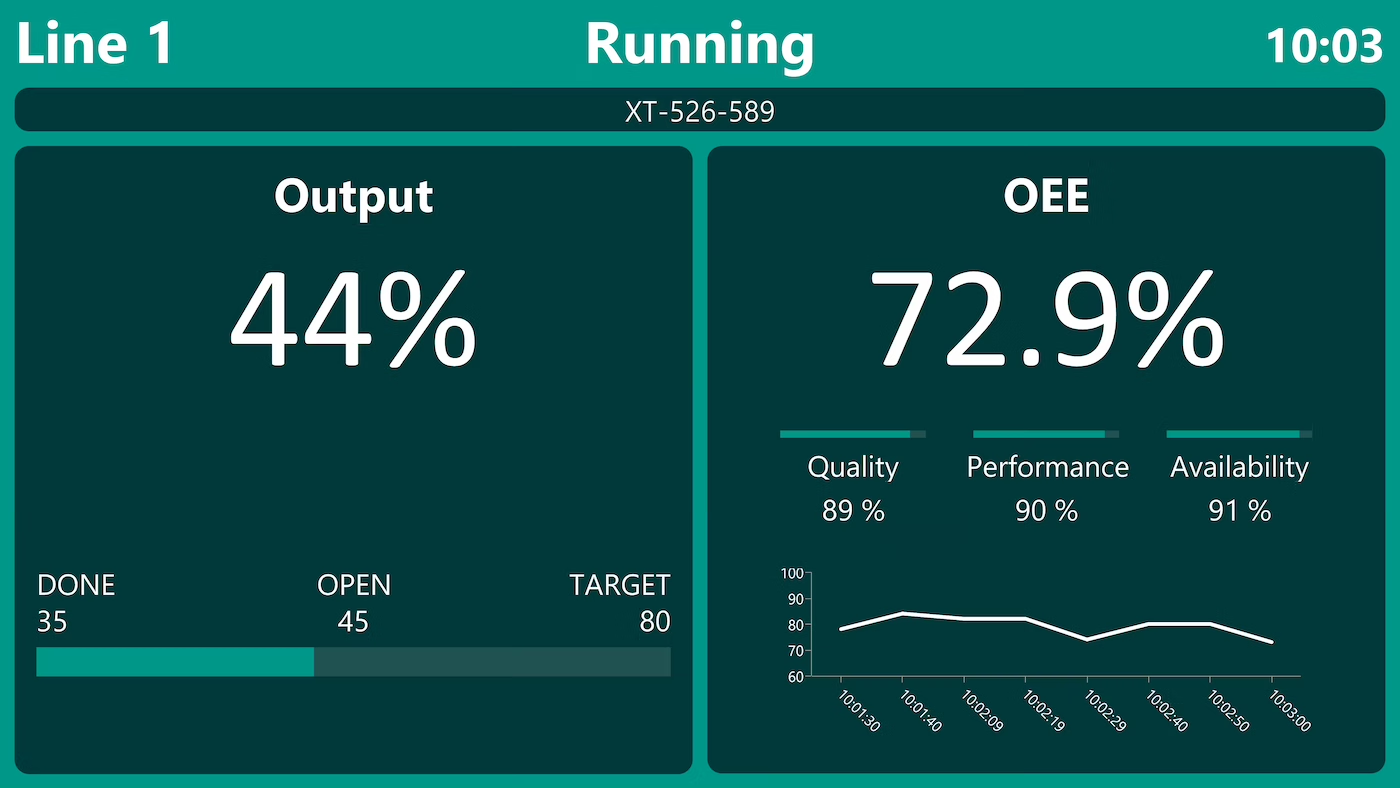

Start Immediately · No Appointment · Free
If you need support: You'll find tutorials and step-by-step guides on our Helpsite and our YouTube channel. For individual needs, we offer workshops and consulting.
In conversation · With experts · 55 min.
Discuss your specific use case with an expert – briefly provide information about your use case beforehand, and we'll get straight to the point.
You'll get a complete overview of all features and see what's possible with Peakboard in your environment.

With Peakboard, you get a flexible visualization layer above your existing SCADA system that can be adapted to your own requirements. Connecting to existing assets and systems is easy – over OPC UA, Siemens S7, MQTT, or Modbus.
How the direct connection to the controller works is shown on the page about the Siemens S7 data connection.
No. Peakboard replaces neither the control system nor the safety functions of a plant. Peakboard is the visualization and interaction layer above them: it reads data from SCADA, PLCs, MES and ERP, brings it together and makes it usable where the work happens. For process control, standards-compliant alarm management and long-term archiving in the SCADA sense you still need a SCADA system — Peakboard then sits above it as the visualization layer.
Peakboard connects directly to OPC UA, Siemens S7, MQTT, Modbus, Beckhoff TwinCAT, Rockwell and Kepware, as well as MES systems such as FORCAM FORCE, MPDV HYDRA and camLine InFrame Synapse. SAP (S/4HANA, ECC, EWM) is connected via the certified connector, along with SQL Server, Oracle, MySQL, PostgreSQL and REST APIs. That way plant data and order data come together on one board — with no integration project.
Yes. Not every plant needs a full control system. Peakboard talks to the PLC directly — over OPC UA, Siemens S7, MQTT or Modbus. There is no control system in between and no preliminary project just to make data available. You start on one line and roll out once it proves itself.
SCADA environments were designed for isolated networks, and many industrial protocols carry no authentication of their own. The usual OT ground rules therefore apply: segment OT and IT networks, grant access rights individually, connect read-only wherever possible and monitor the traffic. Peakboard fits that model: it reads values along and does not write to the control system, and it runs entirely on-premises inside your own network. There is no cloud requirement — the Peakboard Hub is optional and can be run on-premises as well, so data never leaves the company.
Two routes: the Peakboard Box, a dedicated industrial device running Windows 10 IoT Enterprise in an aluminium housing, DIN-rail mountable and running in a secured kiosk mode — or your existing hardware. With the BYOD license the visualization runs on the Windows PCs, tablets and industrial displays already in use at the line. Either way: 1 device = 1 license, no matter how many people look at it.
The Peakboard Designer can be downloaded for free and connected to first data sources the same day — no account, no time limit. A first productive application is typically live in under 5 days. The full rollout to further assets and sites usually takes under 3 months.