Your Modbus TCP client — dashboards & data processing in minutes

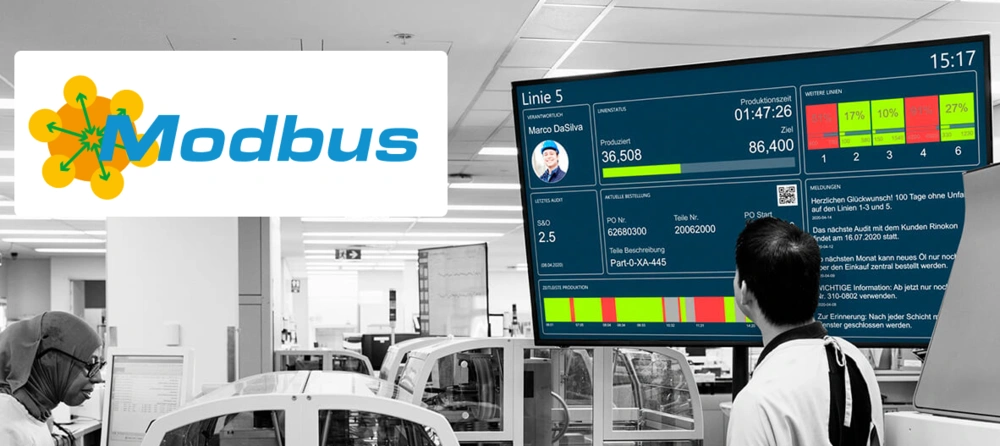
Visualize Modbus — quickly, flexibly and completely without programming

With Peakboard, you can build scalable dashboards for your Modbus TCP data in no time at all — without any programming. Connect machines, sensors or PLCs, read out values and visualize them live in a user-friendly interface. Process, write back or link the data to ERP, MES or BI systems — flexibly, quickly and reliably.

Mockup of a desktop monitor with opened Peakboard Designer software that shows a user interface for production monitoring. A dialog box for binding a text field to display percentages from a data source is opened in the middle.

Peakboard Designer

  • For Windows
  • No account required — get started right away
  • Get a download link via email

Flexible and scalable — developed for your requirements.

Create interactive dashboards & applications

Whether touch screens, IPCs or large monitors: With Peakboard Designer, you develop applications that are tailored exactly to your processes — clickable, reactive and can be used in operation.

An illustration of a real-time data dashboard

Smart logics — completely without code

Build your own if-then rules, processes, or user interactions with just a few clicks. With Peakboard, you can adapt your applications exactly to your requirements — without scripting.

Setting a UI element in Peakboard Designer with 'Workstations' data source and user-defined template

Motivated employees

Keep your team informed with real-time updates on individual progress, KPIs, and overall processes.

Illustration of motivated employees around a joint dashboard with the heading “Employee KPIs” — symbolizes uniform performance indicators and team cohesion.

Quick integration

Ready to use in just a few days — not just months. No IT support or programming skills required thanks to low-code technology.

Peakboard illustration “Fast Integration Interfaces” with SAP, OPC, Excel, SQL database and cloud signal.

Connect, analyze & use data

Whether it's SAP, SQL, PDF, Excel, REST, SQL, MQTT, OPC UA or machine control — integrate your data sources centrally and process them live with data flows.

The graphic shows a range of visualization options in Peakboard Designer

IT security

Peakboard runs entirely on your network, so your data stays secure within your company.

A graphic that shows a lock symbol for a sign that should stand for IT security.

100+ data sources

Peakboard connects your systems and brings all data to one platform — for visualization, automation and individual applications.

Used by industry experts
to cleverly simplify processes.

For example, industrial companies use Peakboard to simplify complex processes and make them measurably better.

White Würth logo (2010) as vector graphic on transparent background
Markus Abel
Project manager automation and digitization in the packaging sector at Würth
Peakboard offers a solution that not only creates transparency in the packaging plant, but also in the entire order picking system.
Logistics hall at Würth (Image credit: Scanner Ltd)
Rosenberger logo as a distinctive lettering
Stefan Speigl
IT Application Manager at Rosenberger
“In the past, it was not only impossible to see the status of all machines at a glance, but it was also cumbersome to make adjustments to the displays. Today, information from multiple systems can be linked together and displayed on a single dashboard. This can be adjusted by us independently and easily, which significantly increases flexibility. ”
Industrial control unit with cable connections and plug connections on an outdoor installation.
Pistenbully Logo
Michael Hofmann
Manufacturing planner
Peakboard provides us with a tool that makes visualization and digitization in the sense of Industry 4.0 easy and practical implementation.
Snow groomer on a snow-covered ski slope under clear skies, with a snow plough and roller in front for piste preparation.
binder logo
René Spranger
Strategic Logistics Team Leader, Franz Binder GmbH & Co. Elektronische Bauelemente KG
Peakboard enables us to pragmatically implement digitization with minimal IT effort. The solution is intuitive to use, can be flexibly developed internally and ensures noticeable efficiency gains in our processes through transparent data provision. Our employees benefit from improved availability of information — and we as a company benefit from higher productivity and faster response times.
Exterior view of a modern commercial building with a glass façade, rows of windows, and an entrance area.
Logo of the brand Zarges in blue lettering.
Martin Lemmer
Head of IT EMEA at ZARGES
“Easy implementation and use was important to us. Peakboard offered many standards in the SAP environment and was able to integrate all data sources without programming effort. In addition, even before making the decision, I noticed that we could use the graphical interface intuitively and easily adapt it. ”
Employee displays battery-powered tools and accessories at a workbench in the workshop.
Logo of Bizerba
Yasin Öztürk
Digitalization Project Manager at Bizerba
“At first glance, the complete digitization of our processes appeared to us as a mammoth task. However, we quickly realized that this change was a decisive step towards operational excellence. ”
Bizerba exhibition stand at a trade fair with illuminated displays and industrial equipment.
CLAAS logo in green lettering on a white background
Carsten Warzecha
Project Engineer at CLAAS
“The system should be ready for use quickly in order to be able to display the clock and system messages when an AGV is introduced. However, it should also be flexible enough to be able to display information from other interfaces at a later stage. ”
Green combine harvester in a wheat field under clear skies.
Logo of the GBA Group as a clear lettering and trademark.
Sandra Schubert
Process optimization at GBA laboratory group
“With Peakboard, information is now quickly and transparently available right where it is needed and seen. ”
A laboratory technician analyses samples with a microscope in the research laboratory. Depiction of laboratory work, quality control, and scientific analysis in biotechnology.
BWI Group logo: stylised wordmark with blue lettering on a white background.
Jordan Marlin
Manager Operational Technology, Industry 4.0 Engineering at BWI
“Using Peakboard has improved our quality, increased efficiency and motivated employees. The implementation was extremely fast. Overall, it was a small step with a big impact.”
Company building of the BWI Group with a modern glass façade and corporate logo. Depiction of the company location, IT service provider, and modern architecture in a business environment.
Prym logo
Thomas Hösch
SAP organization and project management at Prym Group
“With Peakboard, we have a quick and efficient way to make adjustments to the distribution of work. ”
A woman explains handicrafts in a workshop, participants sit in a cosy circle with crafting materials.
Logo of Helmut Fischer with a simple, modern typeface.
Andre Fimpel
Head of Lean Management at Helmut Fischer GmbH
“Only Peakboard met our requirements for standardized interfaces to various systems, in particular SAP, and the visualization of shop floor data in real time and without programming. ”
Modern manufacturing hall with automated machines and employees in production. Representation of Industry 4.0, digital production, and efficient manufacturing processes.
Aquis logo as a clear vector logo in modern typography
Denis Maljkovic
Head of Production and Industrialization at Aquis
“After a few short conversations with Peakboard and watching the online videos provided, I was able to design the interface myself without the help of the Peakboard team, right down to the integration of our corporate identity. ”
Aquis Team

Start now with Peakboard and simplify your processes

Turn live data into smart decisions — with Peakboard.