Aggregate and Archive Sensor Data with Peakboard Hub Flows
With Peakboard Hub Flows, you can condense and archive large volumes of sensor data in Peakboard Hub automatically: one Hub Flow calculates the daily values, a second one moves older raw data to an archive list.
04.11.2026
·
5 min read

- A Hub Flow can pre-aggregate raw data so that all applications can use the same daily values.
- Shortly after midnight, for example at 1:00 AM, the minimum, maximum and average temperature of the previous day are written to the Hub list TemperatureDaily.
- A second Hub Flow moves raw data older than 7 days to an archive list 15 minutes later.
- This keeps the raw data table small while the older data stays available.
The example shows both patterns with the data of a temperature sensor.
Why condense and archive raw data
Machines and sensors in warehouses and factories produce large amounts of data continuously. Peakboard applications use this data to visualize it, provide insights or send a notification when anomalous values are detected.
Pre-aggregate the data
Often, condensed values are all the applications need. An application might show the minimum, maximum and average temperature of the last 7 days, for example, while the sensor delivers a new value every 6 minutes. If several applications use the same data, each one would have to aggregate it itself. It is simpler to aggregate the data once in advance and make it available to all applications.
Archive older data
Over time, the raw data tables grow very large and queries slow down, especially when several applications access them multiple times a day. To keep the raw data table small while the older data stays available, a Hub Flow can move data older than 7 days from the raw data table to an archive table.
The source data
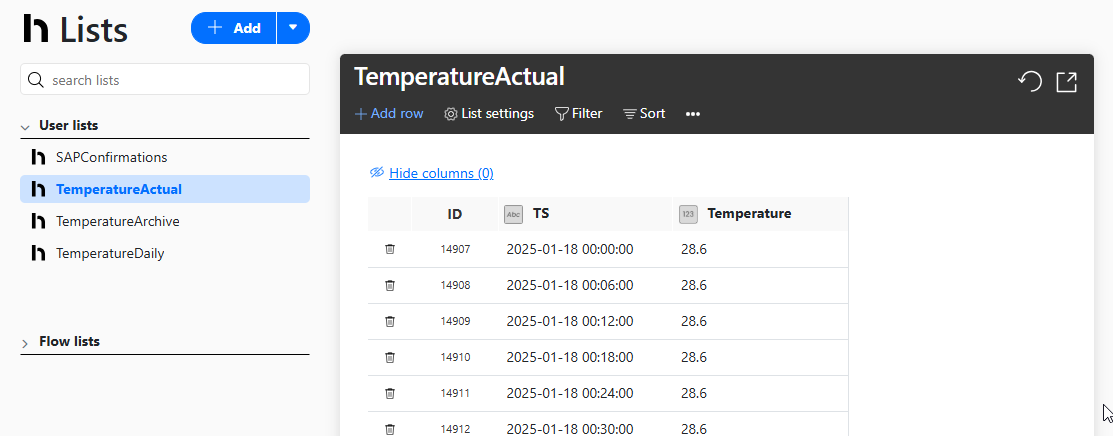
The raw data is stored in the Hub list TemperatureActual. A new row is added every 6 minutes: the TS column holds the timestamp and the Temperature column the measured value. The article Historize MQTT data with Peakboard Hub Flows explains how sensor readings get into a Hub list via MQTT. The queries in this example expect TS in the format yyyy-MM-dd HH:mm:ss and Temperature as a number.
Hub Flow for aggregation
The Flow project contains two Hub Flows. The first one, AggregateTemperature, condenses the raw data. It takes four steps to set up.
1. Hub list for the daily values
The Hub list TemperatureDaily holds the daily values. It gets a Date column of type String and the columns MinTemp, MaxTemp and AvTemp of type Number. In the Flow project, you can then create a data source for this list so that the Hub Flow can write to it later.

2. Data source with SQL aggregation
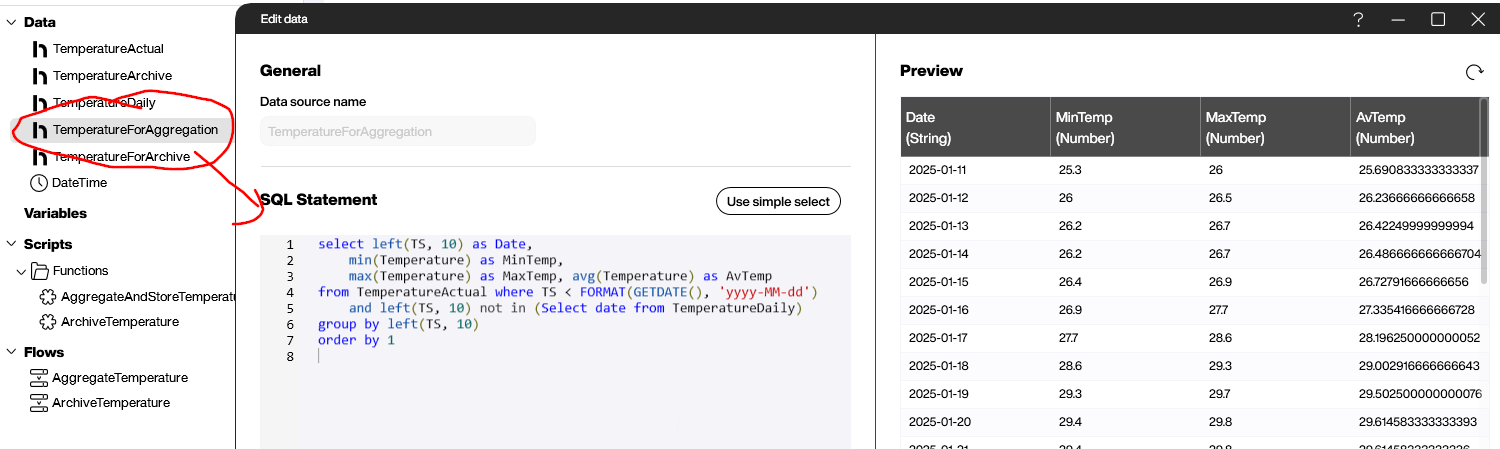
The data source TemperatureForAggregation calculates the daily values with this SQL statement:
select left(TS, 10) as Date,
    min(Temperature) as MinTemp,
    max(Temperature) as MaxTemp, avg(Temperature) as AvTemp
from TemperatureActual where TS < FORMAT(GETDATE(), 'yyyy-MM-dd')
    and left(TS, 10) not in (Select date from TemperatureDaily)
group by left(TS, 10)
order by 1
The where clause does two things: it leaves out the current day, because its values are still being recorded, and it only adds days that aren't already in TemperatureDaily. left(TS, 10) takes the first 10 characters of the timestamp, which is the date without the time. The SQL functions min, max and avg calculate the values.
3. Function to store the values
You can build the function AggregateAndStoreTemperature with Building Blocks. It loops over the rows of TemperatureForAggregation, adds each one as a new row to the Hub list TemperatureDaily and writes the date to the log. Usually, that is one row per day. If a day is missed for whatever reason, the missing row is added the next day.

4. Hub Flow with a schedule
A schedule trigger starts the Hub Flow AggregateTemperature once a day. As the query only aggregates completed days, a time shortly after midnight works best, for example 1:00 AM. First, the Hub Flow reloads the data source TemperatureForAggregation, then it runs the function AggregateAndStoreTemperature.

If TemperatureDaily is still empty on the first run, the Hub Flow writes all missing rows from the past 7 days. After that, it writes one row per day.

Hub Flow for archiving
For the archive, you can create the Hub list TemperatureArchive with the columns TS and Temperature, plus a data source in the Flow project so that the Hub Flow can write to it. The data source TemperatureForArchive selects all rows from TemperatureActual that are older than 7 days and not yet in the archive:
select * from TemperatureActual
where TS < FORMAT(GETDATE() - 7, 'yyyy-MM-dd')
    and TS not in (select TS from TemperatureArchive)
The function ArchiveTemperature loops over these rows and writes TS and Temperature to TemperatureArchive. It then removes each row from TemperatureActual using its ID column.

The second Hub Flow has the same name as the function, ArchiveTemperature. It starts every day after the aggregation, for example at 1:15 AM, reloads TemperatureForArchive and then runs the function.

Combine both patterns
You can use pre-aggregation and archiving separately or together. Another option is to remove the corresponding raw data once it has been aggregated. The raw data is then deleted permanently, which suits data that is only relevant for a short time.
Further reading
You can download the Flow project ArchiveAndAggregate.pbfx and open it in Peakboard Designer. The article on the data historian with Peakboard describes another approach: it explains how to store and analyze machine states in your own SQL database.
Free trial
Try Peakboard Hub for free
Hub Flows are included without limits in the 60-day Peakboard Hub trial, so you can rebuild the example from this article right away.

Why pre-aggregate sensor data?
Many applications only need condensed values such as the daily minimum, maximum and average. A Hub Flow calculates them once, and all applications can use the result.
When should the Hub Flows run?
Both run once a day with a schedule trigger. As they work with data from previous days, a start shortly after midnight works best, for example 1:00 AM for the aggregation and 1:15 AM for the archiving.
Does archiving keep the data?
Yes. The Hub Flow first writes each row to the archive list TemperatureArchive and only then removes it from the raw data list TemperatureActual. The data stays available in TemperatureArchive.
How does the example query the Hub lists?
With SQL statements in the data sources, for example with min, max and avg for the daily values.
Which values does the aggregation calculate?
The minimum, maximum and average temperature per day. The Hub Flow writes them to the columns MinTemp, MaxTemp and AvTemp of the Hub list TemperatureDaily. The current day is left out because its values are still coming in.