Manufacturing Dashboard: Visualizing Production Data on the Shop Floor
How production data from PLCs, ERP and machines is visualized in a manufacturing dashboard and what makes a good shop floor dashboard.
02.07.2026
·
8 min read
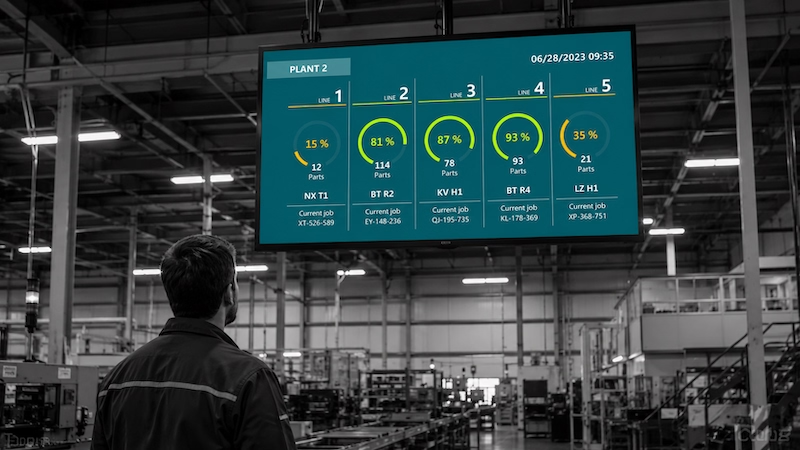
- A manufacturing dashboard shows OEE, throughput, downtime and order status in real time on the shop floor.
- The data comes directly from machines (PLC, OPC UA), ERP (SAP, Dynamics) and other sources – with no manual transfer.
- Peakboard makes the visualization possible without programming skills – low-code, on existing hardware, live in a few days.
- Dashboards can be designed differently for each audience (operator, shift leader, plant management).
Peakboard connects SAP order data, PLC machine signals and quality data in one central dashboard and shows the operator on the display exactly what they need for their shift – no printout, no switching systems, no delay. That is production data visualization with Peakboard: no spreadsheet that arrives two hours too late, no information lost between systems, no dashboard that is never opened again after launch.
What is a manufacturing dashboard?
A manufacturing dashboard is a digital display surface that visualizes production KPIs in real time. It replaces manual status reports, printouts and outdated spreadsheets with an automatically updated view that makes all relevant information accessible at a glance.
Peakboard builds manufacturing dashboards on top of existing data sources – without its own database, without a separate server. The connection to the machine controller, the ERP and other systems is made through low-code configuration, not programming.
What data belongs on a shop floor dashboard?
The answer depends on the audience:
- Operator dashboard: order number, target quantity, actual quantity, cycle target, current fault messages and next job. No distraction from data the operator cannot influence.
- Shift leader dashboard: OEE per line, downtime by cause, open actions, order status for all lines.
- Plant management: daily output vs. plan, weekly trend, KPI comparison across lines and shifts.
Peakboard enables a dedicated dashboard for each of these audiences on the same platform and with the same data sources.
Data sources for manufacturing dashboards
A dashboard is only as current as its data sources. Peakboard connects to over 100 data sources typically present in manufacturing plants:
- Machine controllers: PLC (Siemens S7, Beckhoff, Allen-Bradley), OPC UA, MQTT, MTConnect
- ERP systems: SAP (RFC, OData), Microsoft Dynamics, proALPHA
- Databases: SQL Server, MySQL, Oracle
- Files and cloud: Excel, CSV, SharePoint, REST APIs
Visualization types for production data
Not every KPI needs the same format. Proven visualization types for production data:
- Traffic light: quick status per machine or line – green running, yellow idle, red stopped
- Gauge: OEE value on a scale, readable at a glance
- Time series: OEE trend over a shift or week
- Pareto chart: downtime reasons sorted by frequency
- Progress bar: target vs. actual for quantity and time
Connection to shop floor management
Production data dashboards are the basis for evidence-based shop floor management. The daily shop floor meeting at the SQCDP board needs current figures – not estimates from the day before. Downtime tracking supplies the data for stoppage analysis. And the OEE metric is the central control figure on every production dashboard.
What this looks like as a finished application is shown by the Visualize Production Data solution: OEE, cycle times, scrap rates and machine status come together on one dashboard, connected to ERP, MES, OPC UA or Siemens S7. Where the metric itself is the main concern, the path runs through our page about OEE software.
Solution
Manufacturing dashboard with Peakboard
Visualize production data from PLC, ERP and sensors in real time – low-code, on existing hardware, live in a few days.

What is a manufacturing dashboard?
A manufacturing dashboard is a real-time display for production KPIs such as OEE, throughput, machine status and order status – right on the shop floor, updated automatically from machines and ERP.
What data can be visualized?
Machine status (PLC, OPC UA), OEE, cycle times, downtime, order data from SAP or Dynamics, quality metrics and more – all combinable in one dashboard.
Do I need programming skills for a shop floor dashboard?
No. Peakboard is a low-code platform. Dashboards are configured by drag and drop and connected to data sources – without programming.
How many data sources can Peakboard connect at once?
Peakboard supports over 100 data sources simultaneously in one project – PLC, ERP, databases, REST APIs, Excel and more can be integrated in parallel.
Can a dashboard be designed differently for different audiences?
Yes. Peakboard enables separate dashboards for operators, shift leaders and plant management – all on the same data foundation, but with different scope and layout.
How long does it take to build a first dashboard?
With an existing database connection or PLC interface, a first dashboard is ready in hours. More complex multi-line dashboards typically take a few days.