DISPLAYS ON SITE
1 Display
EMPLOYEES
18
Data sources


1 License
One license per display

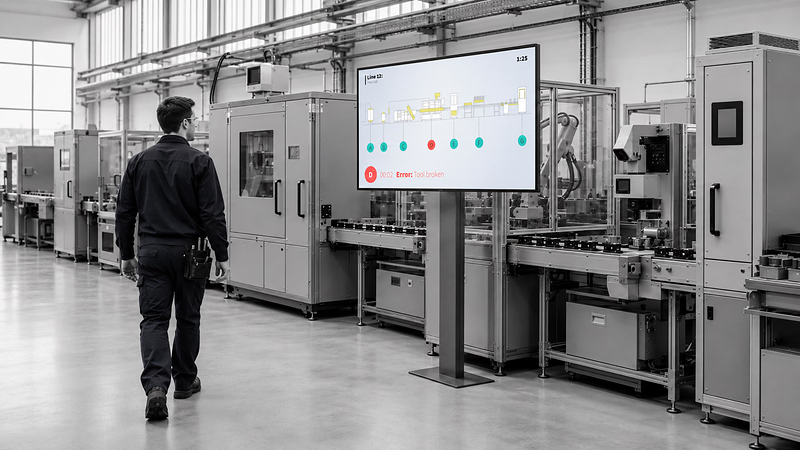
The cross-section dashboard from Peakboard shows an entire production line on one screen. In the background sits a drawing of the plant, on which the individual operations light up – each at the spot where it takes place. The data comes via OPC UA by default.
.avif)


There is no overview of the line as a whole.
A fault is only discovered with a delay.
To find it, someone has to walk the length of the line.
Native SAP connector, OPC UA, MQTT, and dozens of other sources are available out-of-the-box. You just connect, instead of integrating – and the data appears directly at the shop floor.


%201.svg)


%201.svg)


Your own line drawing, an extra operation, a different data source – thanks to the low-code editor and Peakbot, you can adapt the dashboard yourself, no coding skills required.
Whether on the Peakboard Box or your own hardware – both run 100% on-prem, with no single point of failure and no cloud dependency.
Device-based pricing instead of user-based licenses: one license per display, unlimited users per device. More staff on the same display cost nothing extra.



Introducing this dashboard shouldn't take a year. With Peakboard, you start right away – no appointment, no major IT project.

Start Immediately · No Appointment · Free
If you need support: You'll find tutorials and step-by-step guides on our Helpsite and our YouTube channel. For individual needs, we offer workshops and consulting.
In conversation · With experts · 55 min.
Discuss your specific use case with an expert – briefly provide information about your use case beforehand, and we'll get straight to the point.
You'll get a complete overview of all features and see what's possible with Peakboard in your environment.

The background image is a drawing of the plant. The individual operations are lit up on it, so their status can be read at the relevant spot. The template uses OPC UA as its data source; alternatively, you can connect MQTT, Modbus, Siemens S7, Werma, Beckhoff Automation, or Rockwell Automation, among others.
How a single line fits into a wider picture of the machine park is set out on our overview of machine monitoring software.
Each operation is highlighted in color at its position on the drawing. That shows where a step is running, finished, or in error.
OPC UA by default. Peakboard also supports MQTT, Modbus, Siemens S7, Azure Event & IoT Hub, Mitsubishi Electric, Beckhoff Automation, Bosch IoT Gateway, Rockwell Automation, MT Connect, or WAGO, among others.
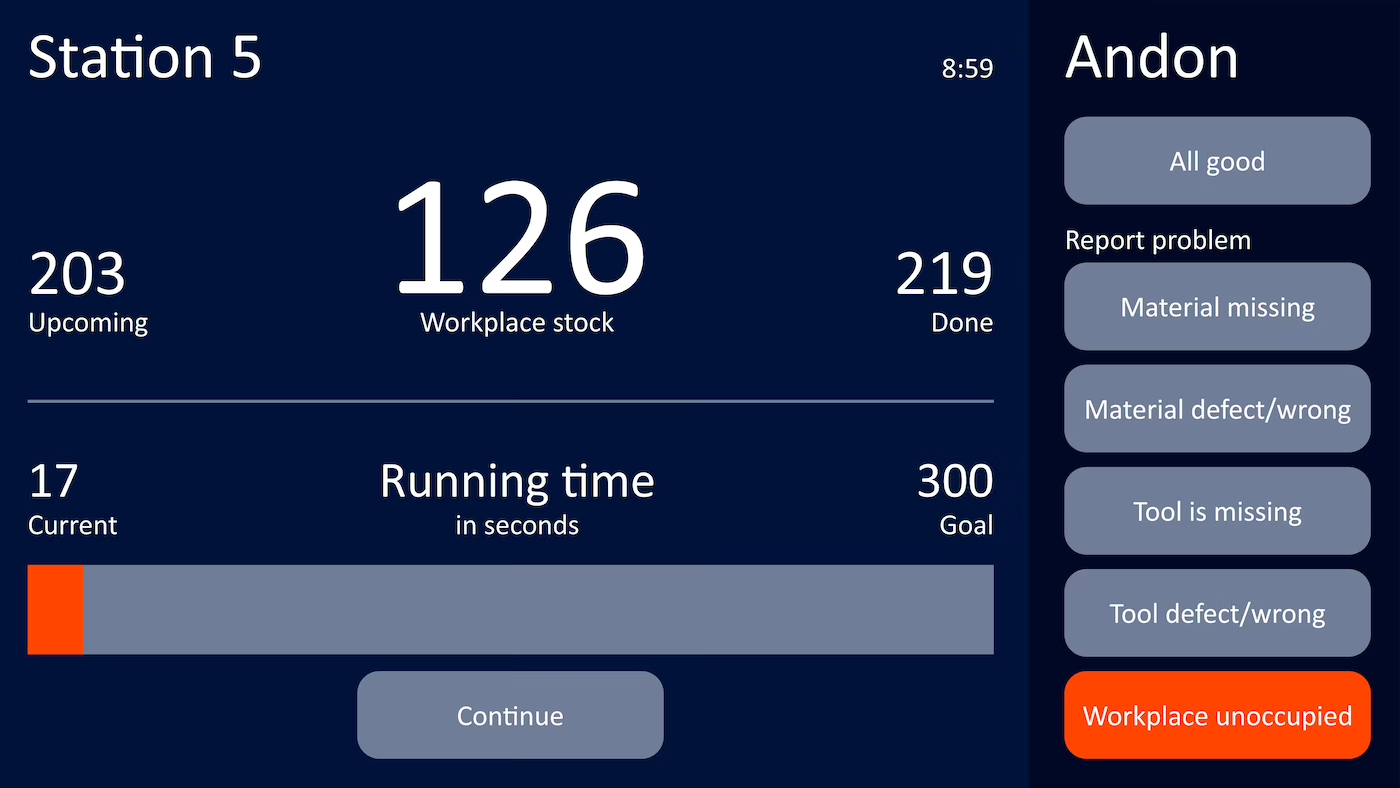
The Andon board shows several workstations as tiles side by side. This dashboard maps the production line as a drawing and shows the status right at the affected spot – built for monitoring and maintenance of a single line.
Yes. The background drawing and the highlighted operations can be adapted to your own line in the Peakboard Designer.
Yes. Peakboard is a low-code platform: you change layout, data source, and display logic by drag-and-drop in the Peakboard Designer.
Peakboard runs entirely on-premises on your own network – production data never leaves your company. There's no cloud requirement, no single point of failure, and you keep full control over your infrastructure.