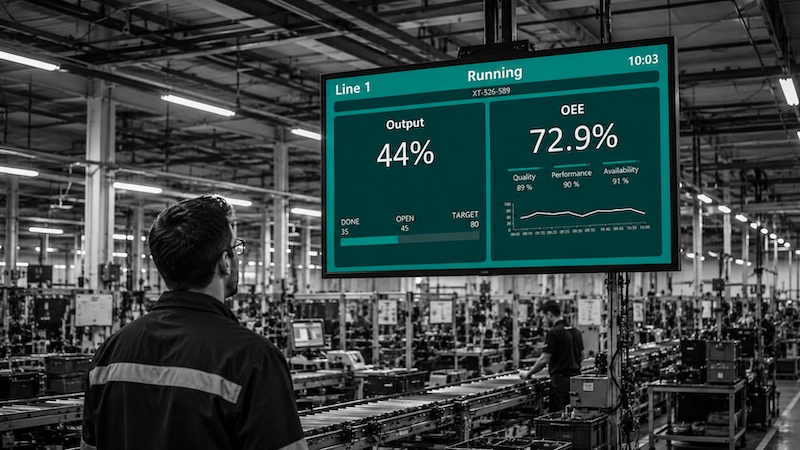
Machine monitoring with Peakboard

Machine monitoring is the continuous capture and display of the operating state of production machines. Peakboard reads status, cycle time, part counts, and fault messages straight from the controller — via OPC UA, Siemens S7, MQTT, or Modbus — shows them on the display at the line, and records them in the Peakboard Hub for long-term analysis. No middleware, no programming, no MES project.

  • 100+ data sources, no middleware
  • Connects without programming
  • 100% on-premises
Over 300 industrial companies from the US and Europe trust Peakboard.
“Using Peakboard has improved our quality, increased efficiency and motivated employees. The implementation was extremely fast. Overall, it was a small step with a big impact.”
Jordan Marlin, Manager Operational Technology, Industry 4.0 Engineering

Monitor machines
without setting up an IT project.

Machine monitoring starts at the controller and does not end at the screen. The signals run live onto the display at the line and are recorded in the Peakboard Hub, so availability, downtime durations, and OEE stay analyzable across weeks. These applications are ready to run. To adapt one to your own lines, you work in Peakboard Designer — in the editor or in a dialog with Peakbot.

Peakboard dashboard with a drawing of the production line in the background and status per operation.

Production Line Cross-Section

An entire production line on one screen – the operations lit up on a drawing of the plant.

Learn more
All
Shop Floor Insights
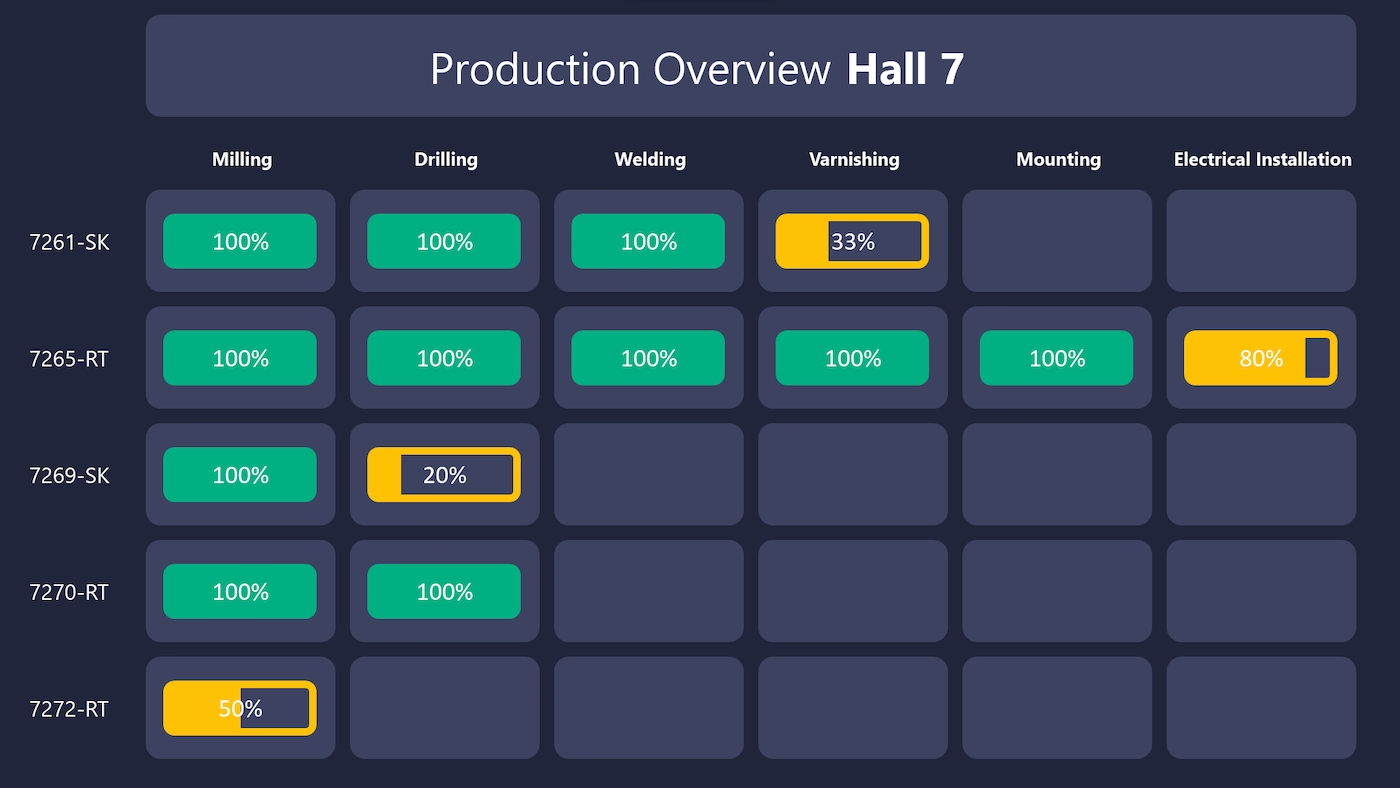
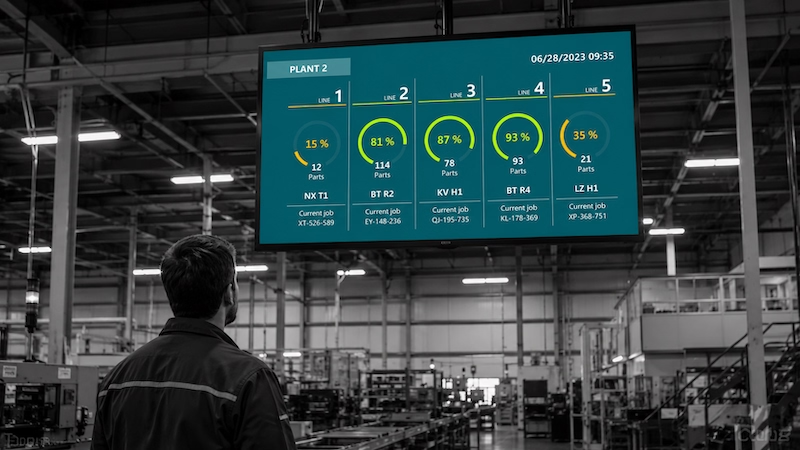
Peakboard status overview of several production lines with progress and key figures from a SQL database.

Multi-Line Status Overview

Show the status of several production lines clearly – with the progress of every operation.

Learn more
All
Shop Floor Insights
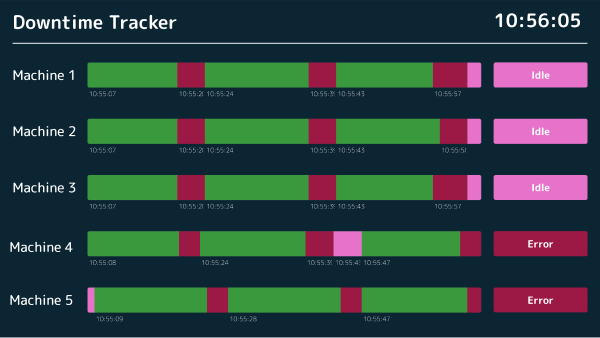
Peakboard downtime tracking dashboard showing machine status and complaint analysis charts

Downtime tracking

Capture machine downtime in real time, analyze root causes, and cut outages for good.

Learn more
All
Shop Floor Insights
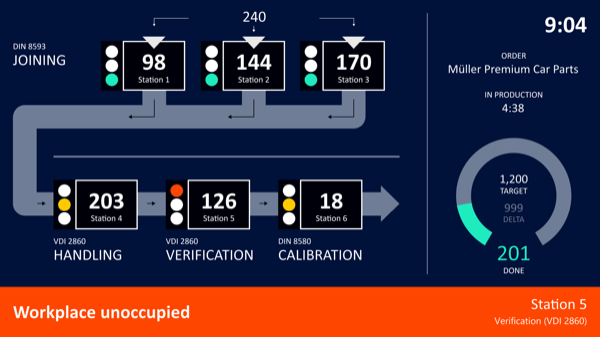
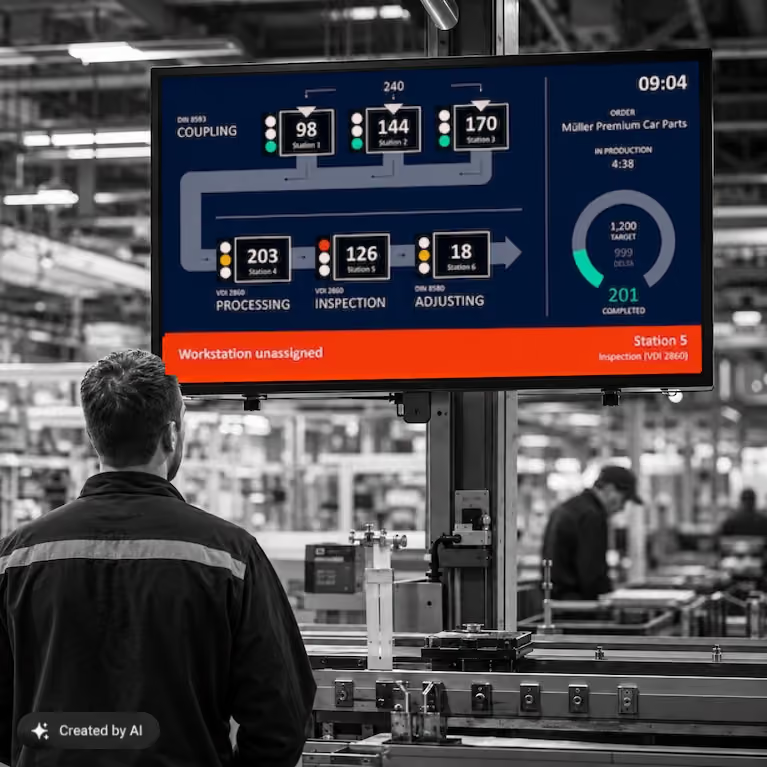
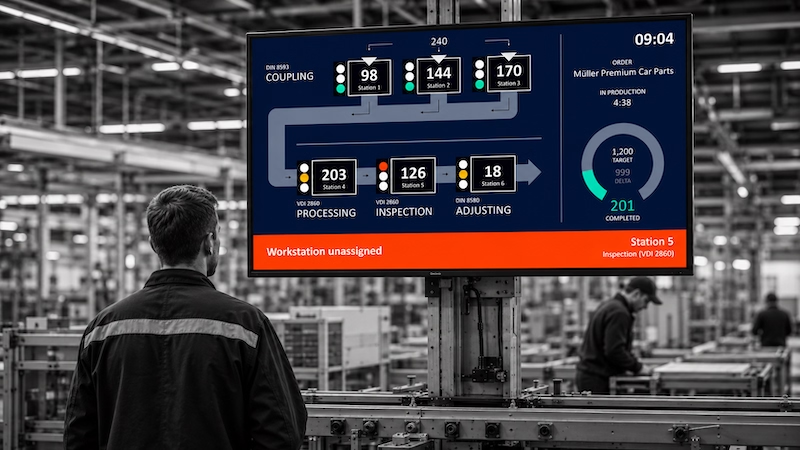
Peakboard andon board showing real-time workstation status with running time and problem alerts

Real-time Andon board

Machine status, faults, and progress in real time—for less downtime.

Learn more
All
Shop Floor Insights
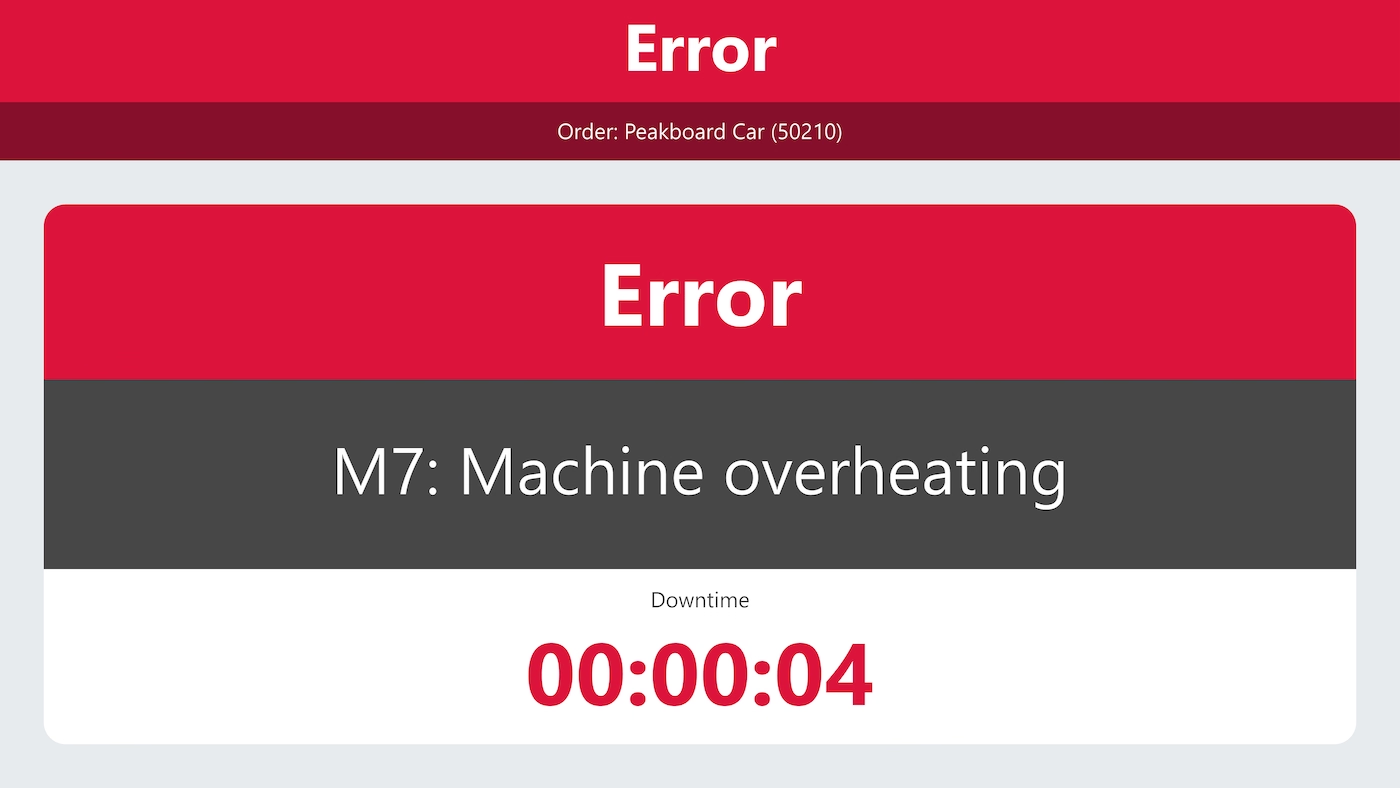
Peakboard alarm monitor displaying production malfunctions in large signal colors for the shop floor.

Alarm Monitor

Show faults and the type of fault message in real time – large and in signal colors.

Learn more
All
Shop Floor Insights
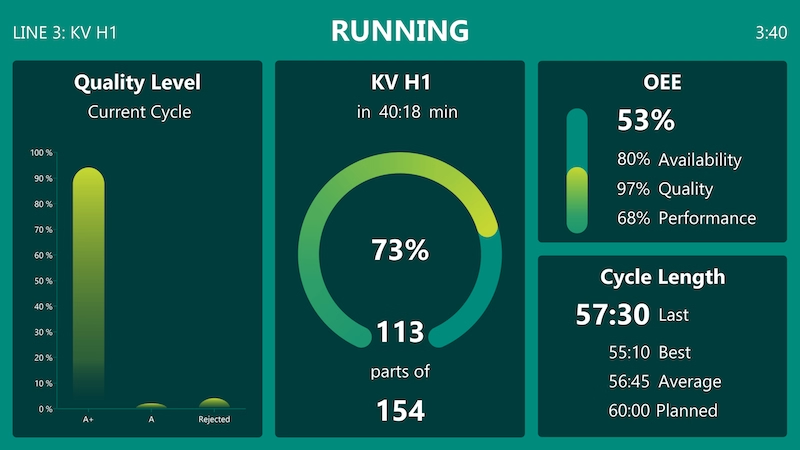
Peakboard workstation dashboard showing real-time production data, machine performance and quality metrics.

Production data dashboard

Capture and visualize production data in real time—spot errors earlier and protect quality.

Learn more
All
Process Automation
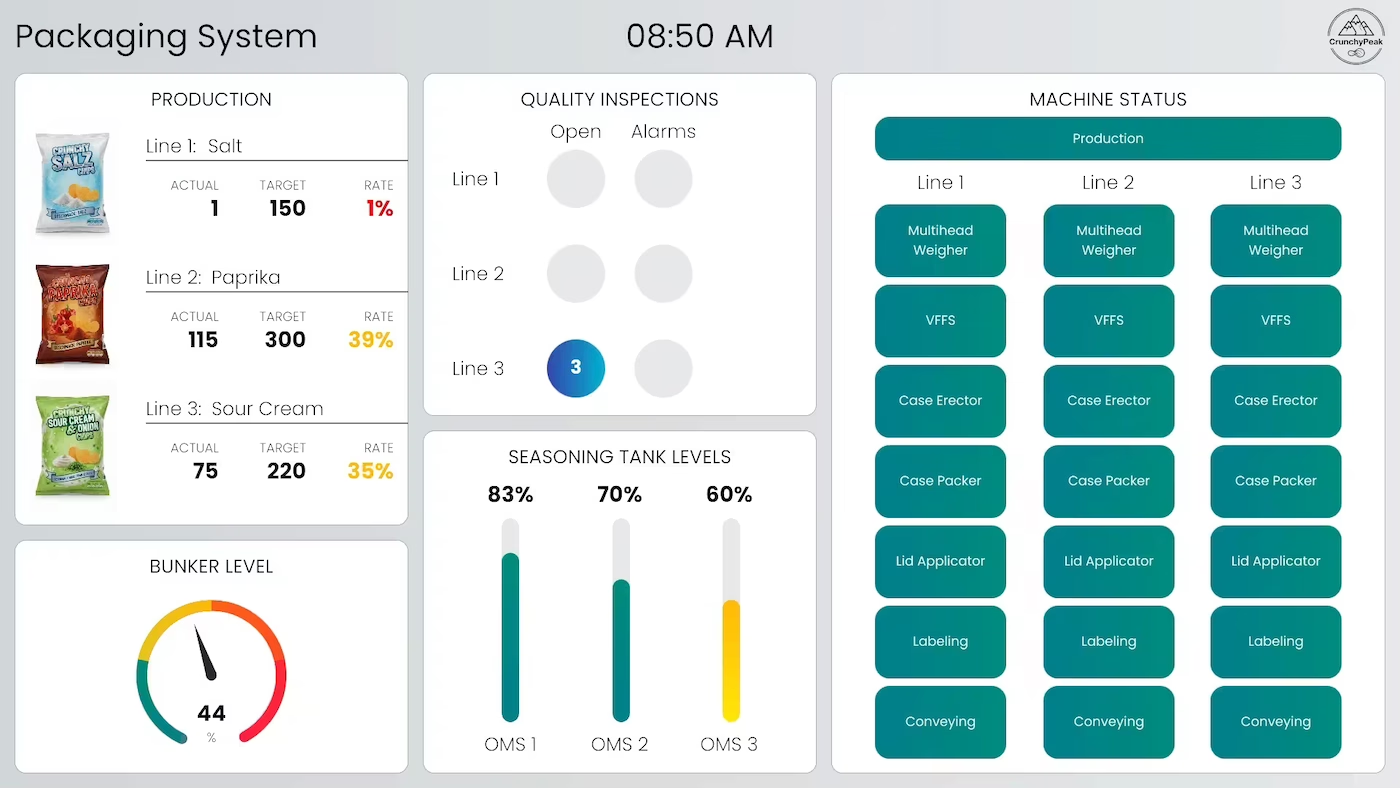
Peakboard dashboard monitoring food packaging lines with production and quality KPIs

Packaging line monitoring

Fill levels, machine status and production progress of the packaging line on one dashboard—spot disruptions before they stop the line.

Learn more
All
Shop Floor Insights
Logistics & Operations
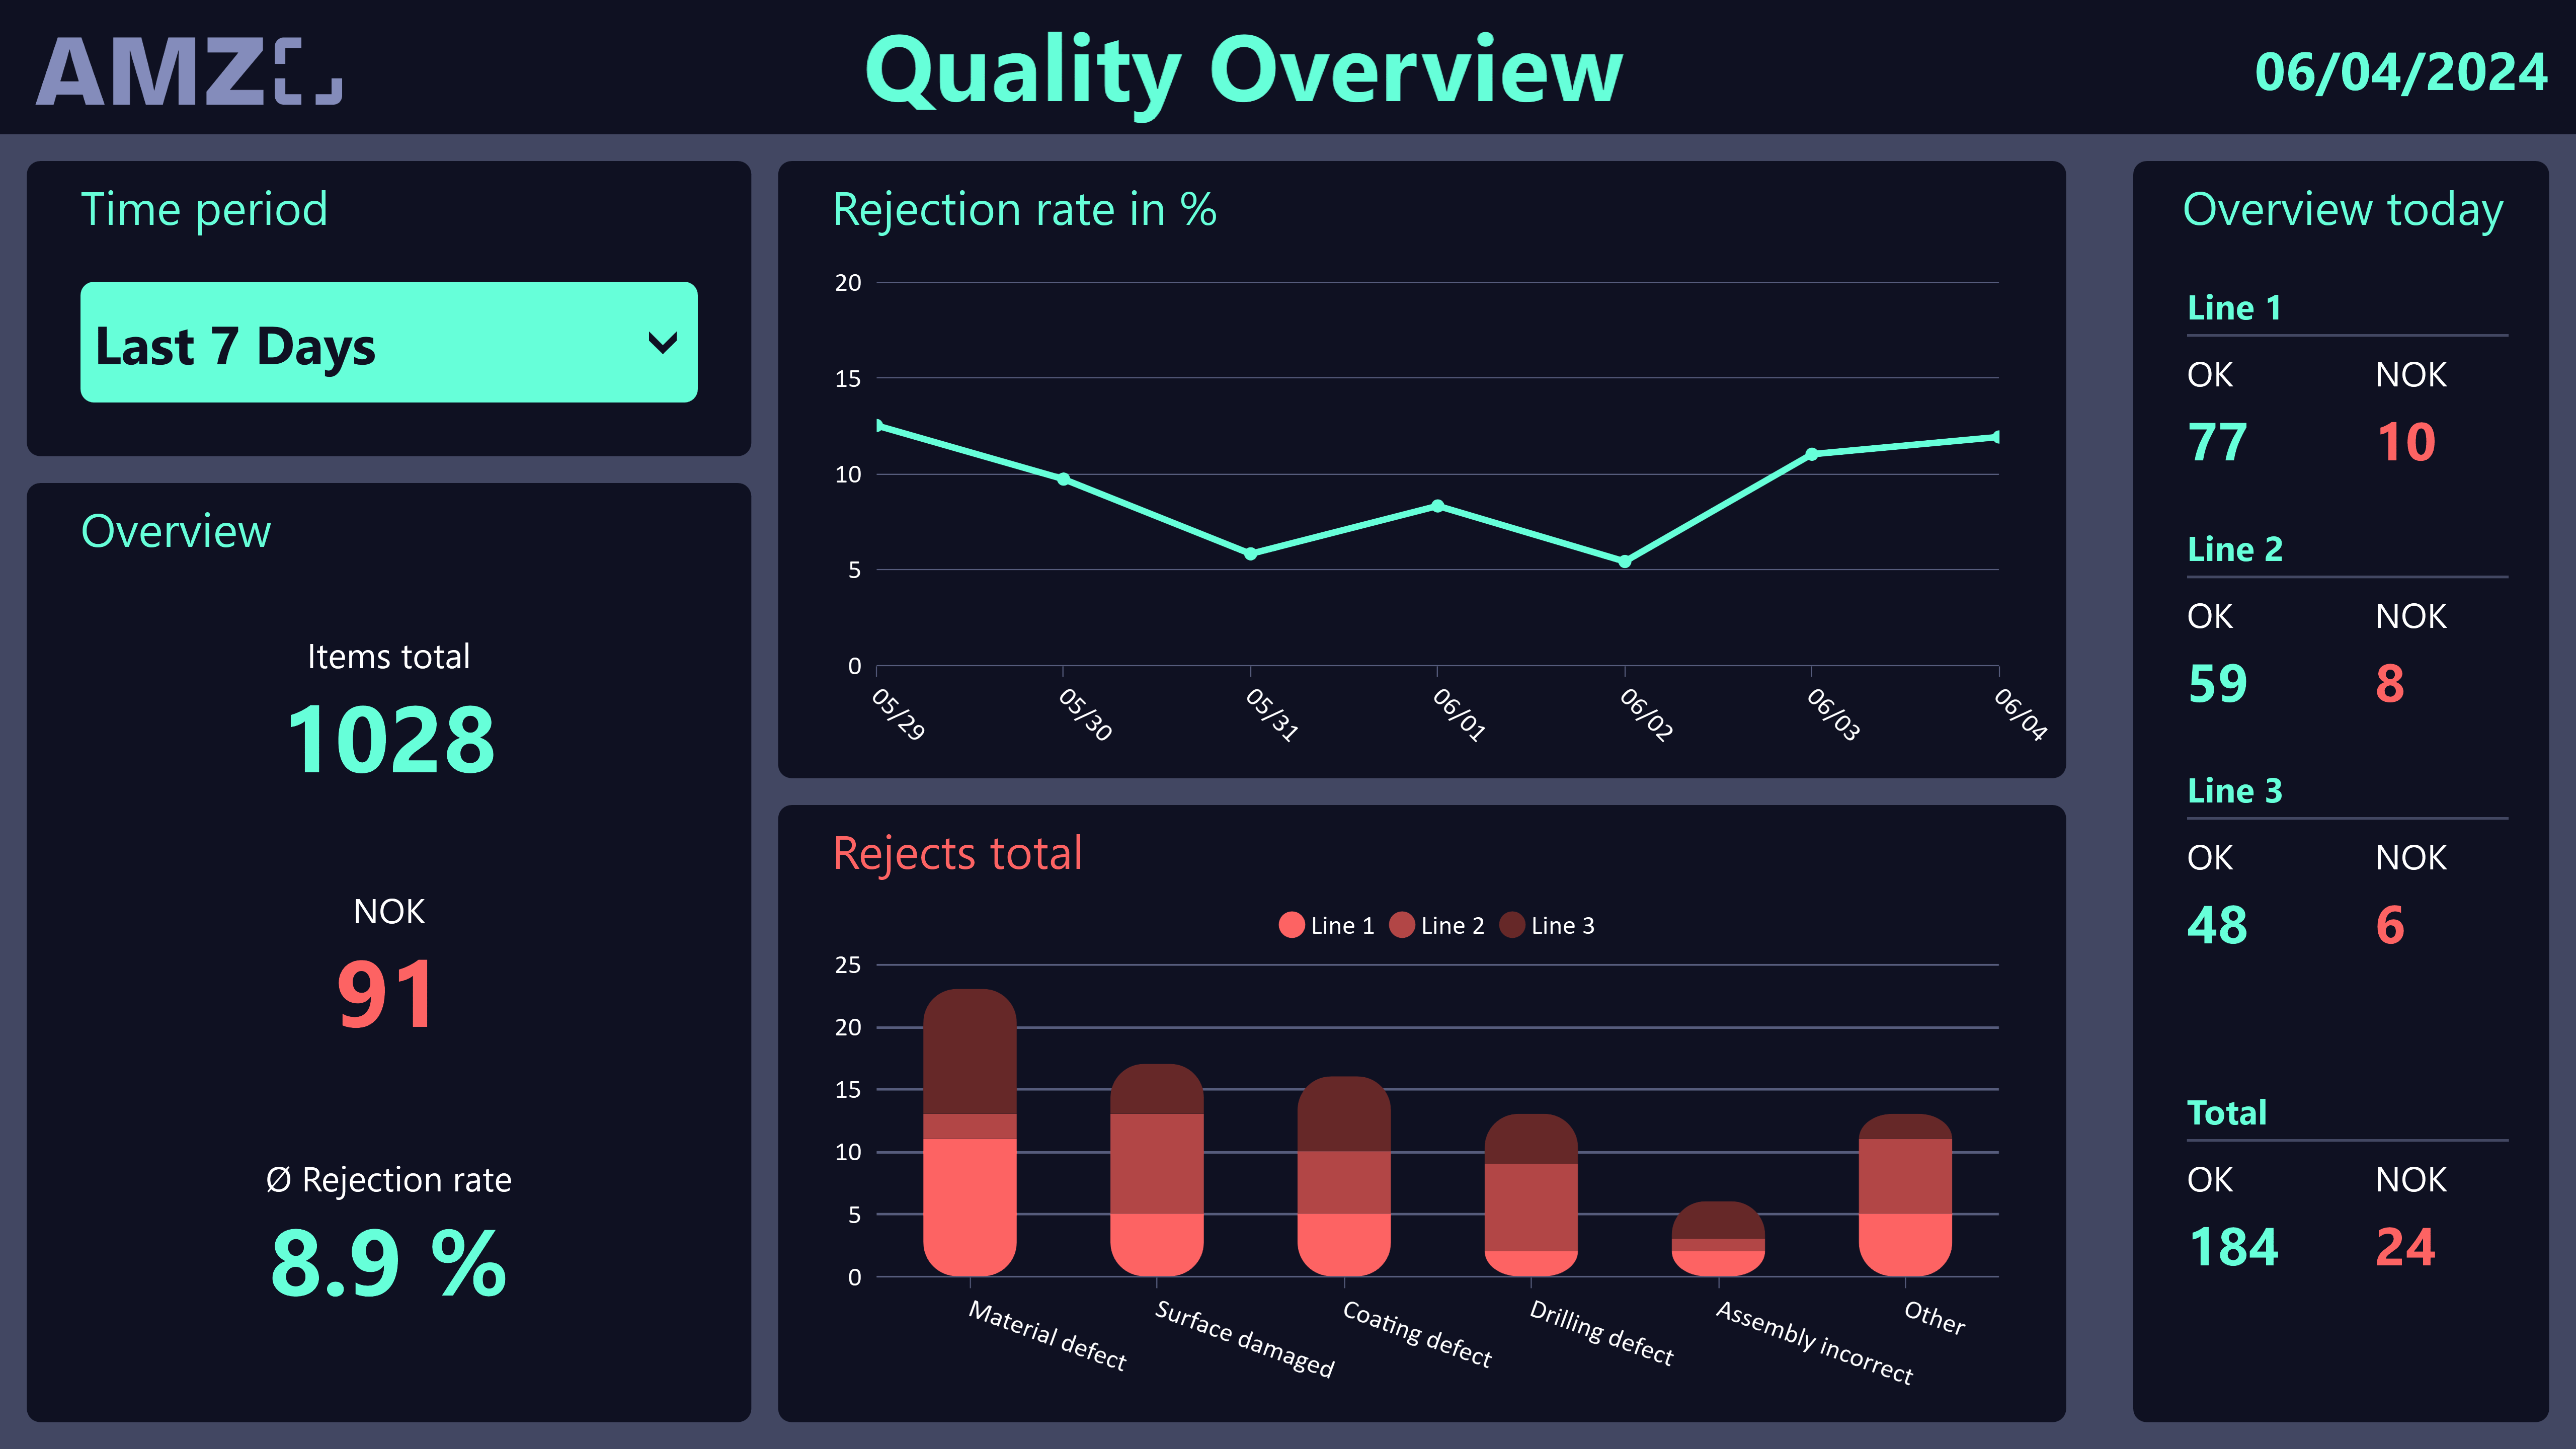
Peakboard production analytics dashboard for series production showing warehouse overview metrics

Series production analysis

Every production step backed by data—detect scrap early, improve OEE, continuously optimize processes.

Learn more
All
Shop Floor Insights
Process Automation
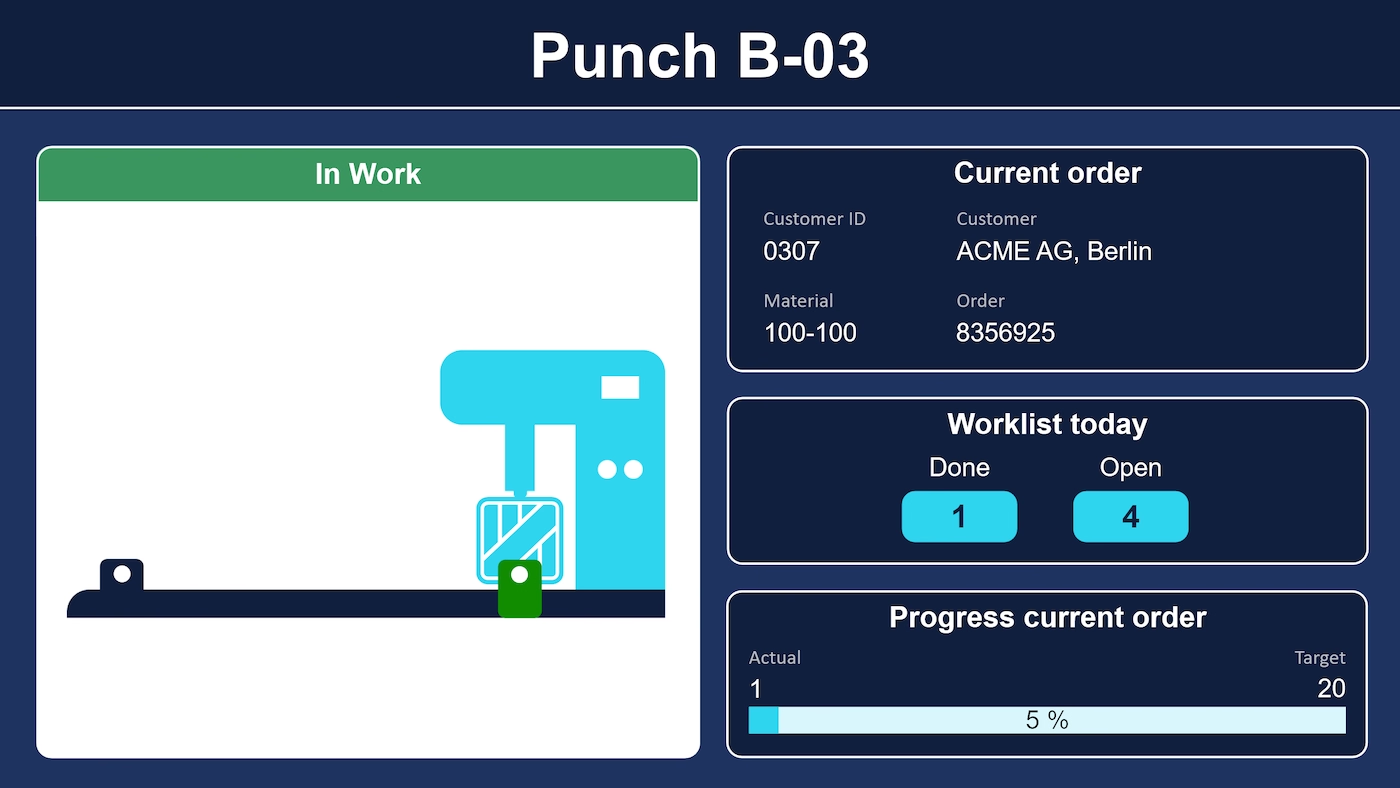
Peakboard control panel for a punching machine, sending commands to a Siemens S7 controller by touch.

Punching Machine Data with Siemens S7

Map a punching machine graphically – with light barriers, punch head, order, workload, and progress.

Learn more
All
Process Automation

From the controller to the analysis

Capture machine data, show it at the line, and analyze it over months — three steps on one platform, with no system break in between.

Why over 300 industrial companies
already trust Peakboard.

100+ data sources — direct, no middleware.

OPC UA, Siemens S7, MQTT, Modbus, Beckhoff, Rockwell, Kepware, MPDV, SAP, and SQL. Peakboard connects to the controller directly and reads the data points instead of fetching them through an intermediate server.

The picture shows various Peakboard data connections. Including: MQTT, Excel, Modbus, OPC UA, SAP, SQL, Siemens s7

Self-customizable — no programming skills required

Drag & drop, low-code editor, and AI: departments can build and customize their own applications — no IT ticket required.

Setting a UI element in Peakboard Designer with 'Workstations' data source and user-defined template

100% on-premises — full data control

Peakboard runs locally on your own network. Data never leaves your premises — no cloud dependency, no single point of failure.

Peakboard illustration “Data Protection” with login field, secure data containers and lock icon.

Scalable without price shocks

Licensing is per display, not per user. You can have as many employees, applications, and interfaces as you like on one device at no extra cost.

Peakboard illustration “Scalable and Secure” with security icon and two people.

Used by industry experts
to cleverly simplify processes.

Precise workforce planning
No bottlenecks
Package volume at a glance
Würth Logistics | Commissioning | Dispatch Goodbye data gaps: Peakboard delivers a forecast for Würth Peakboard offers a solution that not only creates transparency in the packaging plant, but also in the entire order picking system. Markus Abel Project manager automation and digitization in the packaging sector at Würth
Paperless manufacturing
No programming required
Works for employees without PCs
Siemens Industry, Infrastructure, and Building Technology How Siemens brings production data directly to the line Peakboard is a compact solution for quickly, easily, and visually appealingly bringing production data to the line, without complex programming or additional interface development. It supports employees, helping them to work efficiently with the right information in the right place. For us, Peakboard represents a significant step towards greater automation and efficiency. Izzet Kaplan IT Architect at Siemens in Rastatt
Self-service adjustments
Fewer system queries
Fast incident response
Rosenberger Group Manufacturing | Connectors and Cable Assemblies Manufacturing Complete monitoring of production “In the past, it was not only impossible to see the status of all machines at a glance, but it was also cumbersome to make adjustments to the displays. Today, information from multiple systems can be linked together and displayed on a single dashboard. This can be adjusted by us independently and easily, which significantly increases flexibility. ” Stefan Speigl IT Application Manager at Rosenberger
Cross-area transparency
Faster response times
Event-based via OPC UA
PistenBully Assembly, logistics, quality assurance | Special vehicles for slope, beach and environmental maintenance Assembly and logistics in sync with digital Andon boards Peakboard gives us a tool that makes visualization and digitization in the spirit of Industry 4.0 simple and practical to implement. Michael Hofmann Manufacturing planner
SAP & non-SAP in real time
Faster response times
Transparent logistics
Franz Binder Electrical engineering | Logistics How binder makes SAP and non-SAP data usable in real time with Peakboard "Peakboard enables us to pragmatically implement digitization with minimal IT effort. The solution is intuitive to use, can be flexibly developed internally and ensures noticeable efficiency gains in our processes through transparent data provision. Our employees benefit from improved availability of information — and we as a company benefit from higher productivity and faster response times." René Spranger Strategic Logistics Team Leader, Franz Binder GmbH & Co. Elektrische Bauelemente KG
Better robot utilization
Non-invasive retrofitting
More efficient scheduling
ZARGES Production | Light metal construction Optimum robot utilization through visualization of production “Easy implementation and use was important to us. Peakboard offered many standards in the SAP environment and was able to integrate all data sources without programming effort. In addition, even before making the decision, I noticed that we could use the graphical interface intuitively and easily adapt it. ” Martin Lemmer Head of IT EMEA at ZARGES
40% shorter processing time
Lower error rate
More efficient with RFID
Bizerba IT, logistics, production | Metal industry and processing Turnaround time optimized by 40 percent “At first glance, the complete digitization of our processes appeared to us as a mammoth task. However, we quickly realized that this change was a decisive step towards operational excellence. ” Yasin Öztürk Digitalization Project Manager at Bizerba
Clear target vs. actual
Department implements independently
Visual assembly cycle time
Claas Logistics, production | Agricultural machinery manufacturer From Lento to Allegro: The Conductor in Assembly “The system should be ready for use quickly in order to be able to display the cycle time and system messages when an AGV is introduced. However, it should also be flexible enough to be able to display information from other interfaces at a later stage. ” Carsten Warzecha Project Engineer at CLAAS
Status per lab room
Key metrics at a glance
Information right on-site
GBA Group Organization | Laboratory Lab communication 4.0 “With Peakboard, information is now quickly and transparently available right where it is needed and seen. ” Sandra Schubert Process optimization at GBA Group
Real-time planning
Machine status at a glance
All data sources integrated
BWI Group Production | Production of Brake and Suspension Systems Real-Time Data Visualization for Increased Productivity “Using Peakboard has improved our quality, increased efficiency and motivated employees. The implementation was extremely fast. Overall, it was a small step with a big impact.” Jordan Marlin Manager Operational Technology, Industry 4.0 Engineering at BWI
Clear target vs. actual
Targeted root cause analysis
ERP data visualized
Hightech-Electronic Electronics manufacturing / electronic assemblies and devices How Hightech-Electronic uses Peakboard to run the shop floor with greater transparency When material, a tool or a preliminary product is missing, that is not an individual performance problem but a process problem. With Peakboard we can see at every station where time is lost and why. In the past, such issues were spotted at best in random samples, and often only once the damage was done. Klaus Bauer Managing Director, Hightech-Electronic GmbH
SAP data visualized
Transparent workloads
More efficient scheduling
Prym Group Warehouses | Metal industry and processing Warehouse transparency with Peakboard “With Peakboard, we have a quick and efficient way to make adjustments to the distribution of work. ” Thomas Hösch SAP organization and project management at Prym Group
Real-time without IT effort
Faster error response
Standardized SAP connection
Helmut Fischer Logistics, production, quality assurance, purchasing | Electronics/Measurement technology Goodbye paper: Helmut Fischer uses digital shop floor management “Only Peakboard met our requirements for standardized interfaces to various systems, in particular SAP, and the visualization of shop floor data in real time and without programming. ” Andre Fimpel Head of Lean Management at Helmut Fischer GmbH
Implemented without support
Scrap data in real time
Automated data processing
Aquis Systems Production | Sanitary engineering So that the production of faucets flows better “After a few short conversations with Peakboard and watching the online videos provided, I was able to design the interface myself without the help of the Peakboard team, right down to the integration of our corporate identity. ” Denis Maljkovic Head of Production and Industrialization at Aquis
Centrally managed via Hub
Aligned information across teams
Less coordination overhead
Scholz GmbH + Co. KG Production, Packaging, Quality Assurance, Assembly, internal information areas How SCHOLZ centrally provides priorities, shift information, and production data with Peakboard Peakboard makes complex data easily accessible for us. The solution is intuitive, works very well with touchscreens, and helps us keep a clear overview of priorities in our daily work. Anna-Lena Scharf Working student in Data Analysis
Orders visible to all
ERP data visualized
Real-time actual state
Johannes Giesser Messerfabrik Manufacturing, foreman's office | Metal processing industry Giesser sharpens blade production with process data visualization “By using Peakboard, we have become faster and more precise in our processes. The newly gained transparency also reveals further potential for process optimization, which we will gradually use. ” Björn Mutschler Production manager at Johannes Giesser Messerfabrik GmbH
USD 20,000 saved per year
Dashboards built in-house
Productive on day one
L&S Machine Company Manufacturing | Mechanical Engineering | CNC Machining How L&S Machine Company Visualizes CNC Data in Real Time Working with Peakboard and Catalyst Connection has been a great experience. Everyone has been very responsive and open to ideas, and it really feels like a partnership rather than just a vendor relationship. Jason Smathers Manufacturing Manager
Transparent order priority
SAP & Qlik integration
KPIs at a glance
Hermes Schleifmittel Production | Abrasives manufacturer Increasing delivery reliability with real-time applications “Our main goal was initially to significantly reduce delivery times and at the same time increase delivery reliability so that our customers are guaranteed to receive their orders on time.” Sven Russmeyer Plant manager at Hermes
Reaches more employees
Replaces email lists
On-time delivery at a glance
Joh. Clouth GmbH & Co. KG Suppliers to the paper and steel industry | production, administration With Peakboard to the digital bulletin board “We like the simple operation of the Peakboard Designer and that complex designs can still be created with LUA. The first-class support from Peakboard and the speed with which new functions are implemented should be clearly emphasized. ” Marc-Philip Stüttem Head of IT at Joh. Clouth GmbH & Co. KG
Better planning & logistics
Targeted root cause analysis
Order overview
Pankl Racing System Manufacturing | Racing, Luxury Automotive and Aerospace Industries From magnetic board to real-time dashboard “We needed a central presentation of current production data on an Andon board to take the next big step towards operational excellence. Employees should be able to see the status of their system in real time: What is running on my machine here and now? The solution to be selected should also be able to become the standard in our Group so as not to work with a large number of different systems. ” Mario Pichler Head of Automation at Pankl Racing Systems AG
No more manual effort
End-to-end digital
Repair status at a glance
MUNSCH Kunststoff-Schweißtechnik Precision engineering | Mechanical engineering Real-Time Data Visualization for Increased Productivity “With Peakboard, we have achieved efficiency through greater transparency. Employees can see the current status at a glance directly at the workplace and steer their work steps accordingly. ” Oliver Herz Head of Application Development at MUNSCH Group
Faster issue detection
All shopfloor data unified
Corratec Assembly | Bicycle production Smart factory made easy “We created the dashboard ourselves: download the Peakboard Designer, select the components to be displayed, order and set up the Peakboard Box. With knowledge of automation structures, it was easy. There was also a lot of learning by doing and it was fun,” says Sagberger. “The first implementations were up and running after just one week. ” Ralph Sagberger Head of Organization & Production at Corratec
Full order visibility
MES set up quickly
Real-time status
Bon EOOD Production | Pet food More than just low-code visualization “The effects were consistently positive. The overall effectiveness of production has increased and our planning is more accurate. Our processes have also significantly accelerated thanks to MES functions. Our teams are even more motivated than before and develop sporting ambition to achieve the goals.” Mityo Dryankov Director of Maintenance, Innovations and Technology at Bon EOOD

The four core components of the
Peakboard Platform

01

Peakboard Designer

Low-code editor for building your industrial applications.

Learn more
02

Peakboard Box

Compact industrial mini PC – runs applications and communicates directly with machines and sensors.

Learn more
03

Peakboard BYOD

Peakboard on your own hardware ("Bring Your Own Device").

Learn more
04

Peakboard Hub

Central management of all devices, data, and user permissions – historize data, access remotely, and use MCP.

Learn more
Find out more on our
Platform Overview

Two ways to get to know Peakboard

Start Immediately · No Appointment · Free

Start now with Peakboard

If you need support: You'll find tutorials and step-by-step guides on our Helpsite and our YouTube channel. ‍ For individual needs, we offer workshops and consulting.

In Conversation · With Industry Experts · 30 Min.

Book a Personal Demo

Discuss your specific use case with an industry expert – provide brief information about your use case beforehand, and we'll get straight to the point. ‍ You'll get a complete overview of all features and see what's possible with Peakboard in your environment.

Frequently asked questions

What does machine monitoring software do?

Machine monitoring software reads operating and process data continuously from the machine controller, presents it in real time, and keeps it for later analysis: state, cycle time, part counts, scrap, and fault messages, each with a timestamp. Peakboard fills that role with no middleware – the application runs on the Peakboard Box or on existing Windows hardware inside your own network, and the Peakboard Hub handles the history.

Which interfaces are machines connected through?

OPC UA by default. Alongside it Siemens S7, MQTT, Modbus, Beckhoff Automation, Rockwell Automation, Kepware, MPDV, SAP, and SQL. Peakboard connects to the controller directly – no middleware server and no additional driver required.

Can legacy equipment without an interface be included?

Yes, in two ways. Operators report status and fault reason by touch at the terminal, and those entries sit alongside the machine signals read automatically. Where sensors or a gateway are needed on top, the hardware comes from partners such as Softing or Kepware; Peakboard processes and displays the signal.

Is the machine data stored?

Yes. In the Peakboard Hub, machine states can be stored with a timestamp, so availability, downtime durations, and OEE can be analyzed over longer periods. With Hub Flows, that data can be processed further and handed over via REST to an ERP, an MES, or another system – on a schedule or on an event, with nobody having to start anything.

Does machine monitoring replace an MES?

No. An MES runs production end to end – order management, material flow, quality assurance – and needs a project of matching size. Machine monitoring with Peakboard is lean, aimed at transparency, and complements an existing MES rather than replacing it.
Find answers to other questions – visit our  
FAQ page