What Is OEE? Calculating and Improving Overall Equipment Effectiveness
What OEE means, how the metric is calculated and how Peakboard pulls OEE values in real time from machines and ERP – without manual input.
02.07.2026
·
10 min read
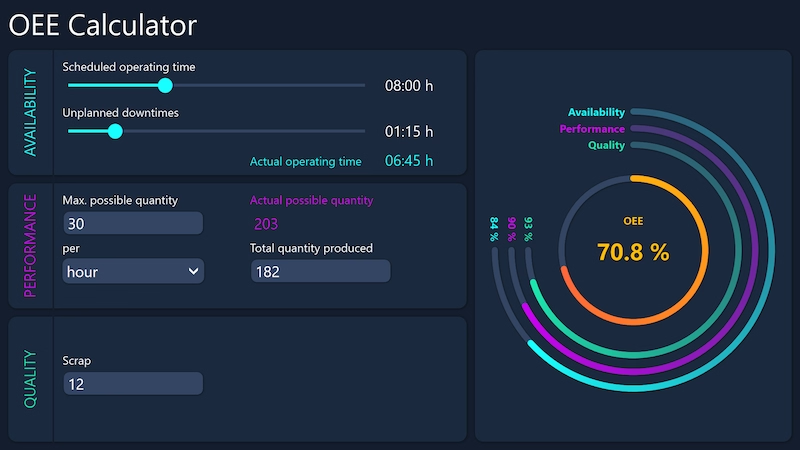
- OEE (Overall Equipment Effectiveness) measures the actual productivity of a machine or line relative to its theoretical maximum.
- The metric is made up of three factors: Availability, Performance and Quality.
- An OEE value of 85% is considered a world-class standard in manufacturing.
- Peakboard calculates OEE automatically from machine data and visualises it in real time on the shop floor.
Peakboard calculates OEE automatically from machine data, PLC signals and ERP order data – and shows Availability, Performance and Quality in real time on the shop floor display, without anyone entering a value by hand. That is OEE monitoring with Peakboard: no end-of-month spreadsheet, no estimated figure, no blind spots between shifts.
What is OEE?
OEE stands for Overall Equipment Effectiveness. The metric measures how effectively a production asset is used compared with its theoretical maximum. OEE was developed as part of the Total Productive Maintenance (TPM) approach and is today one of the most important metrics in discrete manufacturing and the process industry.
Peakboard calculates OEE directly from machine controller signals – with no detour through manual entry or separate systems.
How is OEE calculated?
OEE is made up of three factors that are multiplied together:
OEE = Availability × Performance × Quality
Availability
Availability measures how much of the planned production time the machine actually runs. Stoppages due to faults, maintenance or missing materials reduce this value.
Formula: Availability = Operating time / Planned production time
Performance
Performance measures whether the machine reaches the theoretically possible output during operating time. Causes of performance loss include reduced cycle times, mini-stops or worn tools.
Formula: Performance = (Quantity produced / Operating time) / Ideal cycle
Quality
Quality measures the share of defect-free parts in total production. Scrap and rework push this value down.
Formula: Quality = Good parts / Parts produced
OEE example calculation
A machine runs 7 of 8 planned hours (Availability: 87.5%), produces 90% of the theoretically possible quantity (Performance: 90%) and has a scrap rate of 3% (Quality: 97%). This gives: OEE = 0.875 × 0.90 × 0.97 = 76.4%.
What is a good OEE value?
As a benchmark, an OEE value of 85% is considered world-class in manufacturing. This figure was defined as a target by Seiichi Nakajima, the founder of the TPM concept. In practice, many manufacturers sit between 40 and 60% – which means considerable room for improvement.
- Below 65%: significant action needed, often structural problems
- 65–75%: typical starting point for many plants
- 75–85%: a solid basis, targeted improvements possible
- Above 85%: world-class level by the TPM definition
The six big losses in TPM
The OEE concept goes hand in hand with the six big losses originally defined by Nakajima:
- Unplanned stoppages (Availability)
- Set-up and adjustment times (Availability)
- Idling and minor stoppages (Performance)
- Reduced cycle speed (Performance)
- Start-up losses and scrap (Quality)
- Quality losses in normal operation (Quality)
Peakboard makes all six loss sources visible and attributable in real time.
Calculating OEE automatically with Peakboard
The decisive difference from manual OEE calculation: Peakboard connects directly to the machine controller (PLC, OPC UA, MQTT) and pulls operating times, cycle counts and scrap data automatically. No one has to enter values. No shift leader has to maintain a spreadsheet. The OEE value is always current – on the shop floor display, on the tablet during a walk-through and in the report for management.
Two ready-made applications cover the two usual starting points: the OEE calculator works out Availability, Performance and Quality from entered or connected values. The OEE dashboard shows machine status, OEE and throughput times for a single line in real time; for several lines side by side there is OEE monitoring of several production lines.
Connection to shop floor management
OEE is the backbone of shop floor management. An SQCDP board in the shop floor meeting shows the OEE value as a central KPI. The Andon board escalates automatically when OEE falls below a defined threshold. And the digital shift log documents OEE-relevant events in an audit-proof way for every shift. Which ready-made applications calculate the metric from machine data and show it at the line is set out on our page about OEE software.
Solution
OEE Calculator
Calculate Availability, Performance and Quality automatically – enter values manually or connect data sources directly. With a template to download.

What does OEE mean?
OEE stands for Overall Equipment Effectiveness. The metric measures how effectively a machine is used compared with its theoretical maximum.
How is OEE calculated?
OEE = Availability × Performance × Quality. The three factors are determined as percentages and multiplied together.
What is a good OEE value?
85% is considered world-class by the TPM definition. Many plants start at 40–60% and improve step by step.
Can Peakboard calculate OEE automatically?
Yes. Peakboard connects directly to the machine controller and calculates OEE in real time from run time, cycle count and scrap data, with no manual input.
What are the most common causes of poor OEE?
Unplanned stoppages (Availability), reduced cycle speed from wear or wrong parameters (Performance) and scrap from quality issues (Quality) — the six big losses of TPM.
Do I need an MES for OEE monitoring?
No. Peakboard calculates OEE directly from machine signals without a full MES, delivering OEE values in a few days instead of months.