Digital Andon Board: Real-Time Transparency on the Shop Floor
What is a digital Andon board, how does it work, and what benefits does it bring to production? A practical guide with examples and a 5-step rollout.
01.06.2026
·
11 min read
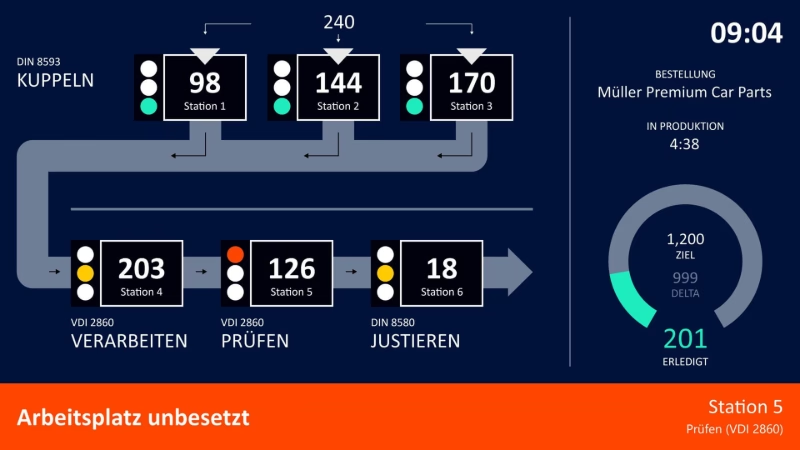
- A digital Andon board visualizes machine and process status in real time.
- It replaces the classic Andon light with dynamic dashboards connected to any data source.
- Typical sources: PLCs, OPC UA, MQTT, databases and ERP systems such as SAP.
- Benefits: faster response times, less downtime, and more visibility on the shop floor.
A machine grinds to a halt — and on a busy shop floor, no one notices for minutes. A digital Andon board closes exactly this gap: it makes the state of production visible in real time and automatically alerts the right people before a brief fault turns into a costly stoppage.
What is a digital Andon board?
A digital Andon board is a software-based display that shows production status, output quantities, cycle times and faults in real time. The term “Andon” originates from the Toyota Production System and refers to a visual signaling system that immediately makes operators aware of problems in the process. While the classic version is a simple traffic light in red, amber and green, the digital version can be linked to any machine data and KPIs.
This turns the Andon board from a mere warning light into a central building block of shop floor management: it bundles information that would otherwise be scattered across individual machines and systems.
How does a digital Andon board work?
Connecting data sources
A digital Andon board is only as good as its data. Through interfaces such as PLC, OPC UA, MQTT or direct database and ERP connections, machine states, quantities and cycle times flow onto the board in real time. The guide How to collect machine data shows how a simple sensor signal becomes usable information.
Signaling and escalation
As soon as a defined threshold is breached — for example a machine stop or output falling below target — the board changes status and triggers an escalation. This can be a color change, a message on a large screen or a notification to maintenance and shift management. Passive display becomes active shop floor communication.
Andon board vs. Andon system: what is the difference?
The two terms are often used interchangeably, but they describe different things. The Andon board is the visual display unit — the screen on the shop floor that shows which line is running and where problems are occurring. The Andon system is the complete concept behind it: board plus signaling plus escalation logic plus data connection.
A complete Andon system typically consists of three components:
- Andon board: The visual display — digital on a large screen or as an app on a tablet.
- Signaling: Andon light (traffic-light system), audible signal or push notification.
- Trigger: Manual via an Andon button or automatic through a threshold from machine data.
Peakboard maps the complete Andon system — from PLC connection through real-time visualization to automatic Teams or Slack notification when a machine stops.
Classic vs. digital Andon board
The classic Andon light signals only one state and must be triggered manually. A digital Andon board captures states automatically, combines several KPIs, stores the history for analysis and can be adapted without changing hardware. That makes it a central tool of visual operator management.
Benefits for production and maintenance
- Faster response times: faults become visible instantly instead of being noticed on the next round.
- Less downtime: faster escalation measurably reduces unplanned stoppages.
- More transparency: everyone sees the same status — from operator to plant management.
- Data-driven improvement: the stored history reveals recurring bottlenecks and provides the basis for continuous optimization.
Real-world example: Andon board with FORCAM machine data
What a digital Andon board looks like in a real production environment is illustrated by a plant running FORCAM as its MES system. FORCAM continuously delivers machine states, OEE values and order progress via its API — exactly the data foundation an Andon board needs.
Peakboard connects directly to the FORCAM API and visualizes the data without an intermediate layer: line status in red, amber and green, current output against the target, OEE trend over the last few hours. When a machine enters a fault state, the board immediately changes color and — coupled with the digital call system — sends a notification to the responsible maintenance group. Response time drops because nobody has to search first.
The key point: the data already flows from FORCAM — Peakboard simply visualizes it where it is needed: right at the line, visible to everyone. No new data capture, no additional system, no IT project.
Andon cord, Andon button and Andon taster: the manual trigger
Not every fault can be detected automatically from machine data. Quality problems, missing material or unsafe situations are noticed by the operator — and need to be reported quickly.
Andon systems offer three typical hardware triggers for this:
- Andon cord: The classic pull rope from the Toyota Production System. Pulling the rope stopped the line or triggered an alarm. Today mostly replaced by digital equivalents.
- Andon button / Andon taster: A physical push button at the workstation. Peakboard supports common industrial buttons via the digital inputs of the Peakboard Box or via third-party devices such as Leetech buttons.
- Touch button: A button on the dashboard itself — for environments without a physical button or as a complement to one.
In all three cases the signal reaches the Peakboard Andon system and triggers the same escalation logic: status change on the board, notification to the responsible team, log entry with time stamp.
Andon in lean management
Andon is not a Peakboard-specific term — it originates from the Toyota Production System and is a core element of lean management. In the modern lean context, Andon is part of visual management: information should be visible where decisions are made — at the line, in real time, for everyone. Digital Andon boards extend this principle by showing not only manually triggered signals but also automatically generated states from machine data — without anyone having to press a button.
The connection to the shop floor meeting is direct: what the Andon board shows in real time is reviewed in the daily SQCDP meeting and translated into actions. Andon provides the signal; the meeting provides the response.
A digital Andon board in 5 steps
- Define the relevant KPIs and fault cases.
- Identify and connect data sources (PLC, OPC UA, MQTT, ERP, MES).
- Set thresholds and escalation logic.
- Design the display for the shop floor and end devices.
- Start a pilot, gather feedback and roll out.
The Andon board from Peakboard can start on a single line and roll out step by step. For the bigger picture, the guide 10 steps to digital shop floor management sets out the overall strategy – delivered with Peakboard’s shop floor management software.
Free template
Try the Andon board template right away
Download the ready-made Peakboard template and connect it to your production without any programming – line status and OEE in real time.

Frequently asked questions about the digital Andon board
What does “Andon” mean?
“Andon” is a Japanese term for a signal light and originates from the Toyota Production System. It refers to a visual system that immediately makes problems in the process visible – a core element of lean management.
What is the difference between Andon board and Andon system?
The Andon board is the visual display unit. The Andon system is the complete concept: board plus signaling (light, button, taster) plus escalation logic plus data connection. Peakboard maps the complete Andon system.
What is an Andon cord?
The Andon cord is the classic pull rope from the Toyota Production System – pulling it stopped the line. Today mostly replaced by digital triggers: physical buttons, dashboard touch buttons or automatic thresholds from machine data.
Which data sources can a digital Andon board use?
Typical sources are PLC controllers, OPC UA, MQTT, databases and ERP systems such as SAP.
Do I need new hardware?
In most cases no. A digital Andon board uses existing controllers and displays. For manual triggers, standard industrial buttons can be connected – or a simple touch button on the dashboard is sufficient.