How to Improve Machine Efficiency: Causes, KPIs and Measures
What machine efficiency means, which KPIs matter and how Peakboard helps make efficiency potential visible and raise it for good.
02.07.2026
·
8 min read
- Machine efficiency measures how well a machine uses its theoretical capacity – summarised in the OEE value.
- The biggest efficiency killers are unplanned stoppages, reduced cycle speed and scrap.
- Peakboard makes efficiency potential visible in real time and shows where which losses occur.
- Typical lever: plants with OEE below 70% can achieve 10–20% more output through systematic measures without investing in new machines.
Peakboard visualises machine efficiency in real time: OEE, cycle times, stoppage reasons and scrap rates flow automatically from the machine controller into the dashboard – no manual entry, no delay. That is the difference between reacting and steering: Peakboard shows which machine is costing efficiency right now – not which one had problems yesterday.
What is machine efficiency?
Machine efficiency describes the ratio between a machine's actual output and its theoretically possible output. The most common metric for it is OEE (Overall Equipment Effectiveness), which combines availability, performance and quality into a single percentage.
An OEE of 100% is theoretical – it would mean a machine always runs, always at ideal cycle and without any scrap. In practice, many manufacturers sit between 40 and 65% OEE. That means more than a third of the capacity is lost – without having to buy a new machine to produce more.
The most common efficiency killers
- Unplanned stoppages: technical faults, material issues or operator errors interrupt production unprepared. Every minute costs efficiency and money.
- Mini-stops and short stoppages: interruptions under 5 minutes that are usually not captured in manual evaluations – but add up considerably.
- Reduced cycle speed: the machine runs, but slower than its ideal cycle – often due to worn tools, wrong parameters or hesitant operators.
- Start-up losses: after a shift change, changeover or maintenance, the machine needs time to reach full cycle.
- Scrap and rework: every defective part uses machine time without a result.
Measuring machine efficiency: the right KPIs
Besides OEE, there are further KPIs relevant for efficiency management:
- MTBF (Mean Time Between Failures): average time between two faults – an indicator of machine condition and maintenance quality
- MTTR (Mean Time To Repair): average repair time – an indicator of response speed and spare-part availability
- Cycle target attainment: share of shifts in which the target quantity was reached
- Set-up time share: share of downtime attributable to set-up and changeover
Measures to improve machine efficiency
Machine efficiency cannot be improved without first knowing where the losses occur. The typical path with Peakboard:
- Create visibility: connect machines, calculate OEE automatically, capture stoppage reasons by touch.
- Analyse patterns: which line has the lowest OEE? Which shift? Which fault reason appears most often?
- Derive measures: targeted maintenance, instruction, tool change or set-up optimisation.
- Measure the effect: track OEE development over weeks and validate the measures.
Connection to shop floor management
Machine efficiency is the core topic of the daily shop floor meeting. The OEE data from OEE monitoring provides the basis. Downtime tracking shows the biggest single losses. And the Andon board reacts in real time when an efficiency threshold is breached.
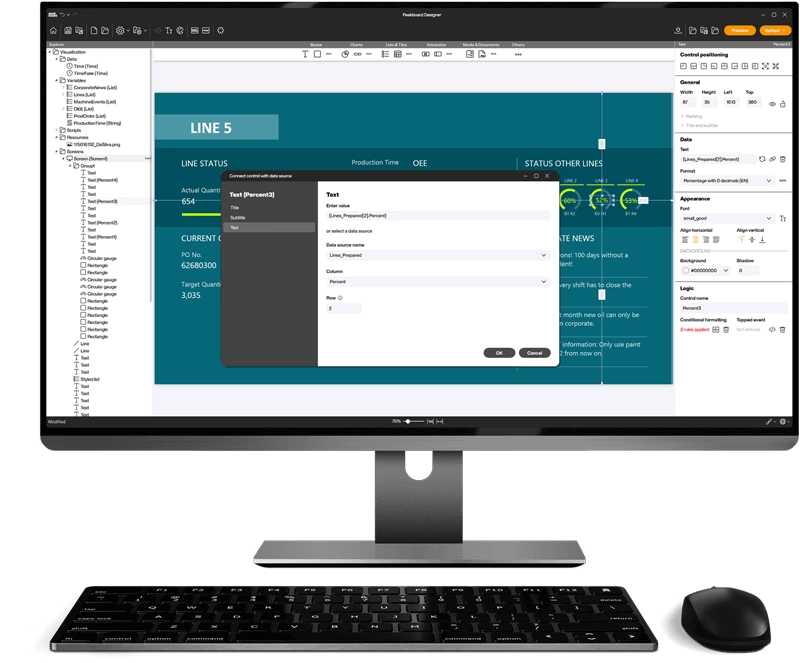
What this looks like as a finished application is shown by the OEE dashboard for a single production line: machine status, OEE metrics and throughput times come together on one screen, and scrap reasons can be added on the touchscreen. More applications built around the metric, from the calculator to the multi-line view, are collected on our page about OEE software.
Solution
OEE dashboard for a single production line
Machine status, OEE and throughput times for one line on a single screen. The template is available to download and can be customised in Peakboard Designer.

What is machine efficiency?
Machine efficiency describes how well a machine uses its theoretical capacity – measured by the OEE value (availability × performance × quality).
How can you improve machine efficiency?
First create visibility: measure OEE, capture stoppage reasons, analyse patterns. Then derive targeted measures: maintenance, instruction, set-up optimisation. Track the effect over weeks.
What is a good OEE value for machine efficiency?
85% is considered world-class by the TPM definition. Many plants start at 40–65% and can gain 10–20% through systematic measures – without new machines.
What are mini-stops and why are they dangerous?
Mini-stops are interruptions under 5 minutes that are usually not captured in manual evaluations. In total they can cost more efficiency than individual longer stoppages – Peakboard captures them automatically too.
What are MTBF and MTTR?
MTBF (Mean Time Between Failures) is the average time between two faults – an indicator of machine condition. MTTR (Mean Time To Repair) is the average repair time – an indicator of response speed.
How long until first improvements become visible?
First insights from pattern recognition emerge after 2–4 weeks of data capture. Measures show measurable OEE improvements typically after 4–8 weeks.