Industrial Vibe Coding

Your Fast Track to Smart Manufacturing

Peakboard makes vibe coding ready for industry. Peakbot turns a short description into a working projec. With real-time data from machines, sensors and SAP – running reliably around the clock, right on the shop floor.

  • Create and change with a prompt, fine-tune by drag and drop – no coding skills needed
  • Over 100 native interfaces to machines, PLCs and SAP
  • Scalable without sticker shock (license per device, not per user)
Over 300 industrial companies from DACH and the USA rely on Peakboard.
“Peakboard allows us to implement digitalization pragmatically with minimal IT overhead. The solution is intuitive to use, can be flexibly developed further internally, and ensures noticeable efficiency gains in our processes through transparent data availability.”
René Spranger, Team Lead Strategic Logistics

Build your first productive application
in just a few days.

Over 50 ready-to-use templates for the most common use cases in manufacturing and logistics – as a starting point or a source of ideas. Use them as they are, or adapt them to your process with a prompt or by drag and drop.

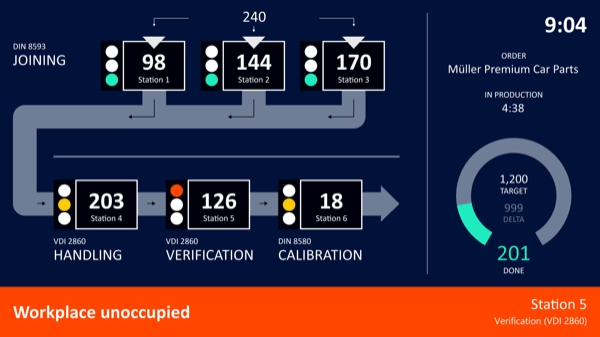
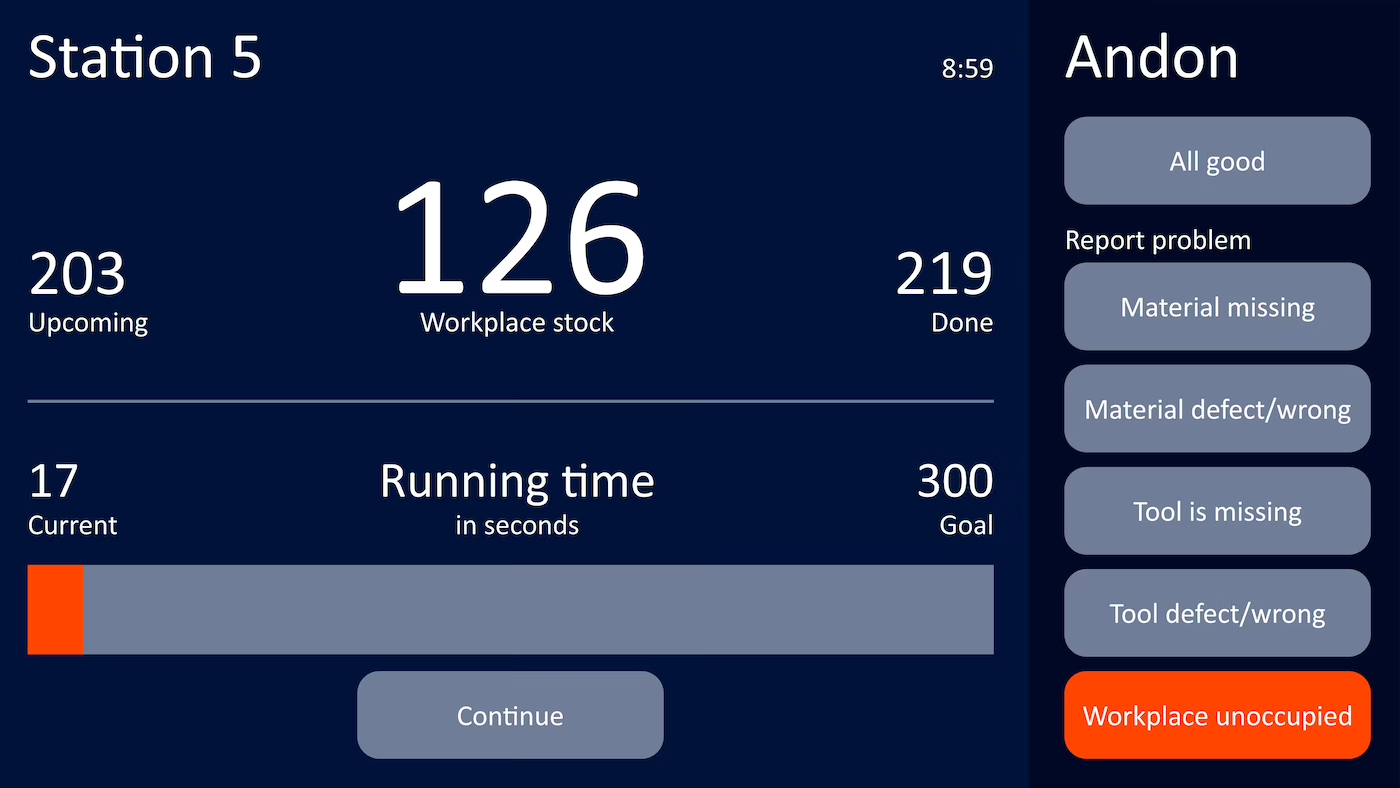
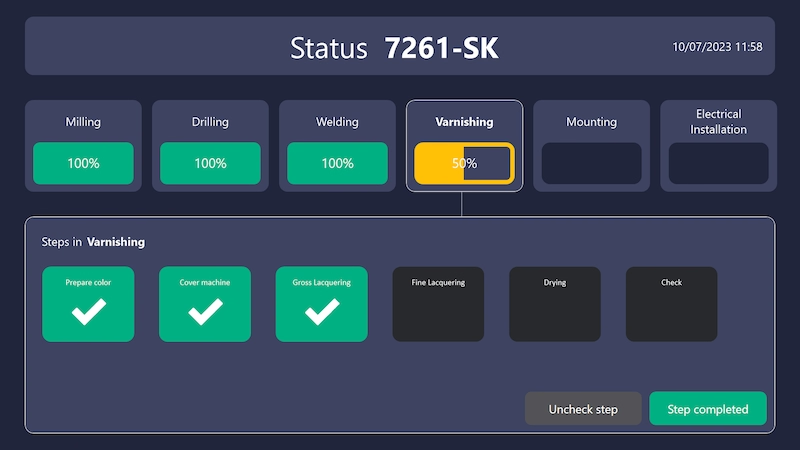
Peakboard andon board showing real-time workstation status with running time and problem alerts
Real-time Andon board
Machine status, faults and progress in real time – for less downtime.
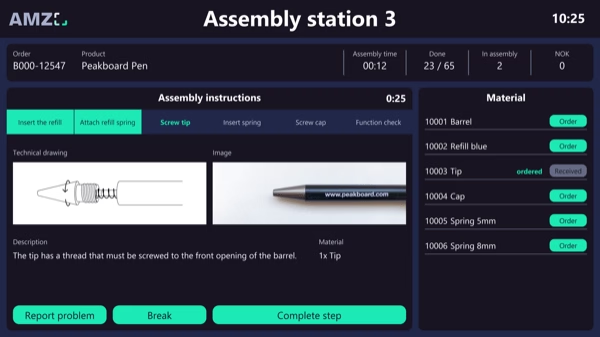
Peakboard interactive worker assistance system showing step-by-step assembly instructions
Worker assistance system
Step-by-step instructions and real-time information right at the workstation – for higher quality and fewer errors.
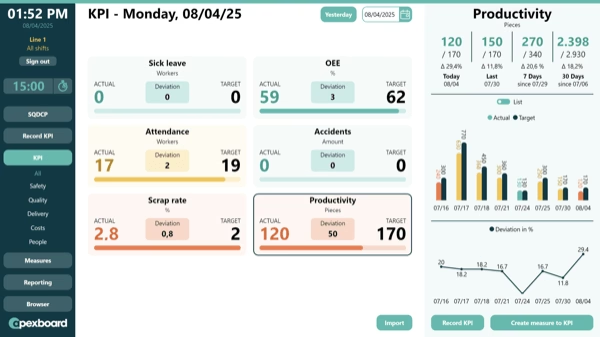
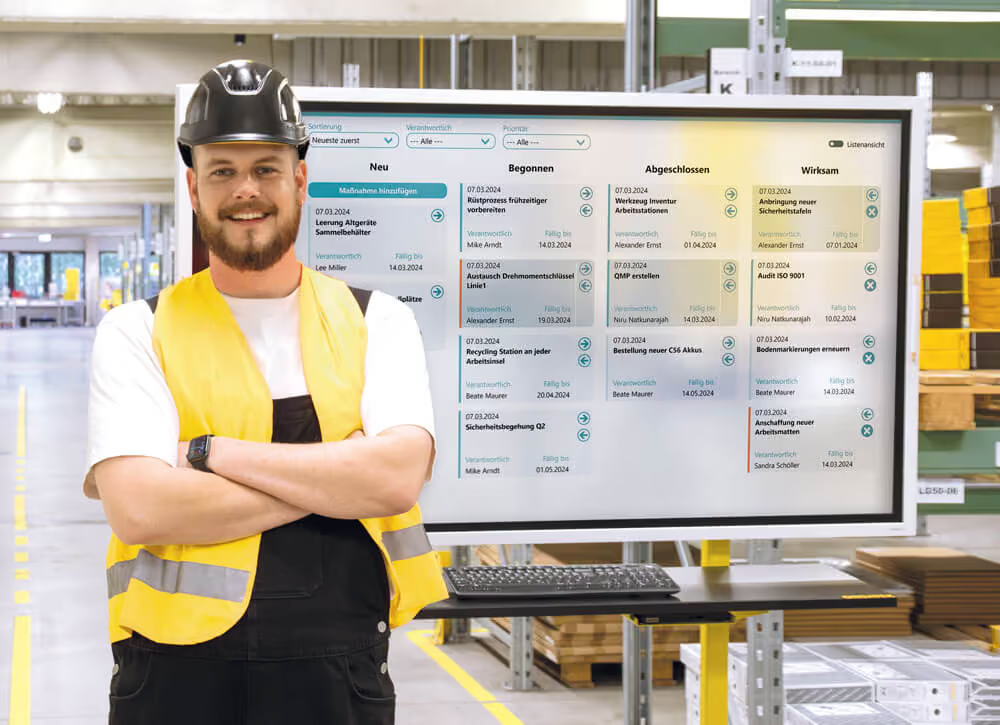
Peakboard shopfloor management meeting board with daily KPIs, productivity charts and actions in one view.
Digital shop floor board
Shorter meetings, clearer outcomes – KPIs, tasks and responsibilities on one board, always current without a whiteboard.
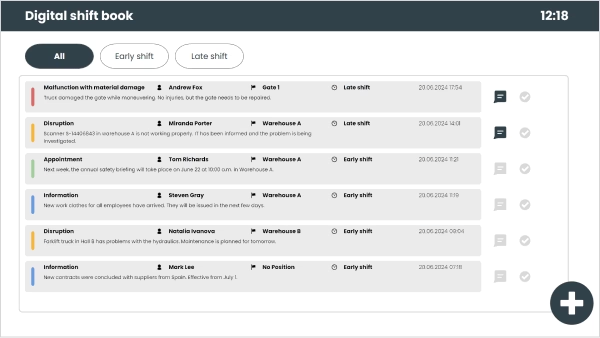
Peakboard digital shift book listing entries such as faults, information and appointments, filterable by shift.
Digital shift book
Shift handovers, notes and events documented centrally – no more paper slips, available any time.
Peakboard interactive dashboard for single-station production.
Single-station production
Capture assembly times, progress and faults per workstation live – transparent and directly controllable.
Peakboard digital assembly instructions app showing step-by-step task list for workers
Digital assembly instructions
Every assembly step on the touchscreen – status updates automatically, fewer errors, faster onboarding of new employees.
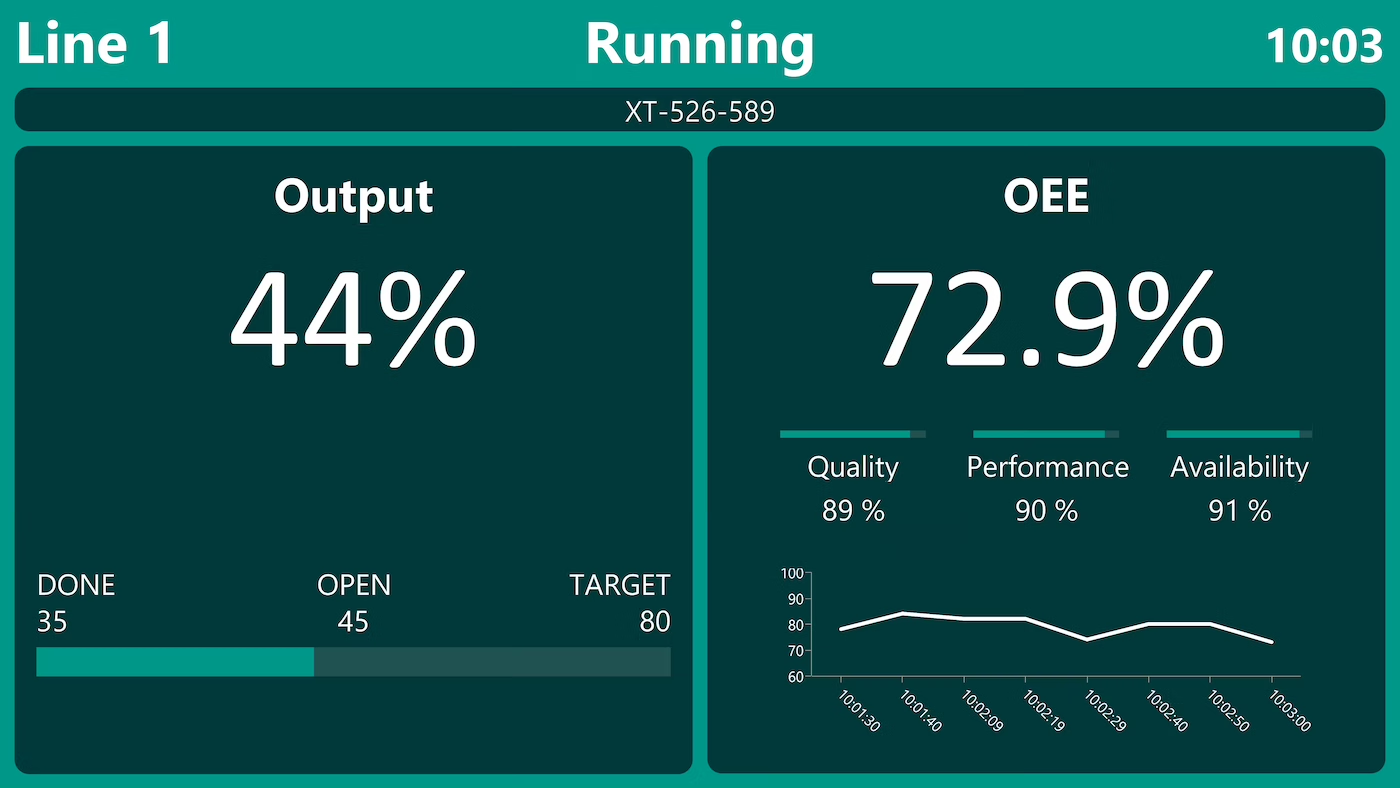
Peakboard OEE dashboard for a single production line showing output and equipment effectiveness
OEE dashboard
Machine status, OEE and cycle times for one line at a glance – spot bottlenecks instantly.
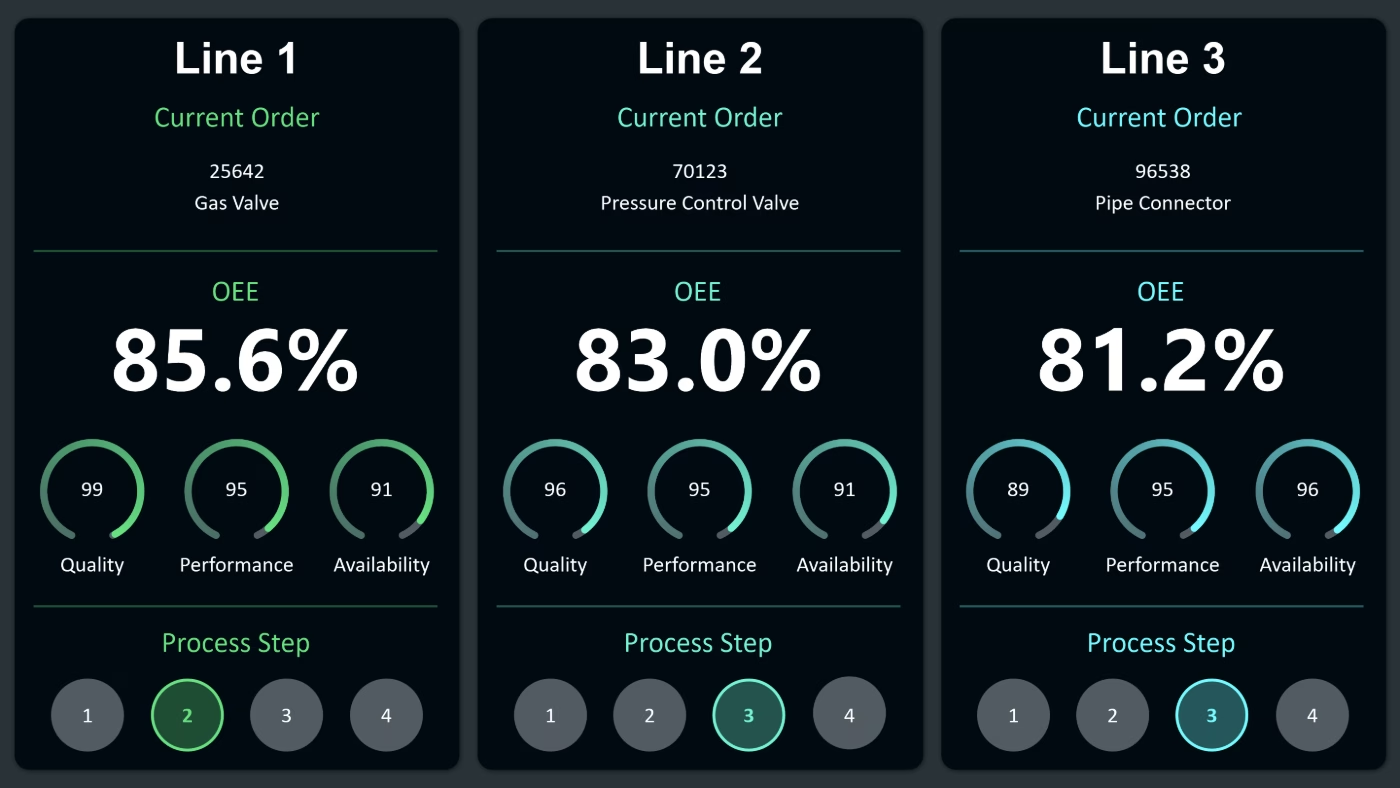
Peakboard OEE dashboard showing overall equipment effectiveness for multiple production lines with andon system
OEE for multiple lines
Machine status, OEE and faults across several lines in one view – made instantly visible with Andon.
Peakboard workstation dashboard showing real-time production data, machine performance and quality metrics.
Production data dashboard
Capture and visualise production data in real time – spot errors earlier and protect quality.
Peakboard energy monitoring dashboard showing power usage over time and consumption per area on a factory floor plan.
Energy efficiency monitoring
Energy consumption visible down to machine level – identify peak loads instantly and cut energy costs in a targeted way.
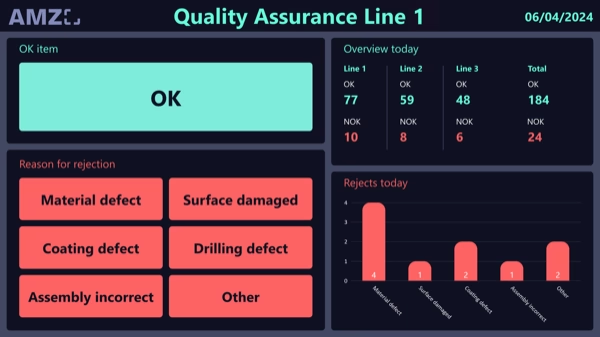
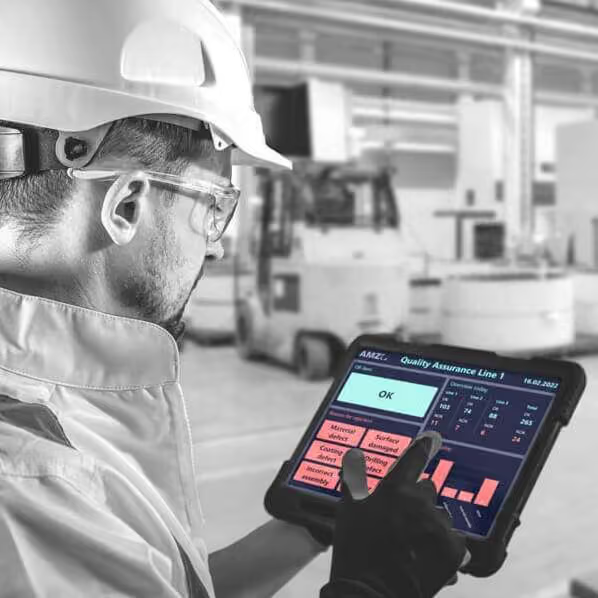
Peakboard quality assurance board for one line with OK status, good and reject counts and buttons for defect reasons.
Shop floor analytics
Production line in real time on the display, deep analysis in Power BI – everything from a single data source.
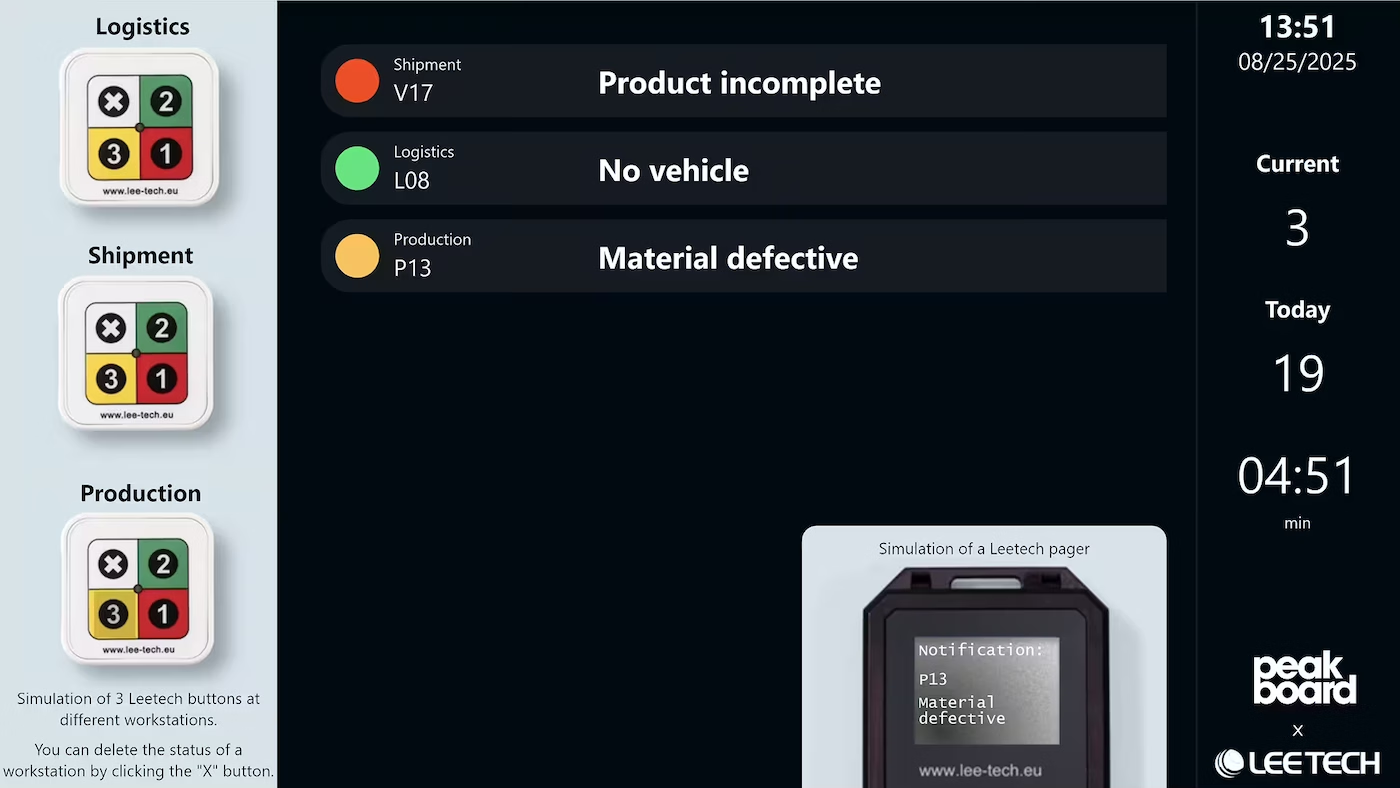
Peakboard digital call system dashboard showing workstation status and andon alerts
Digital call system
Capture service requests in real time, visualise them clearly and route them to the right team automatically.
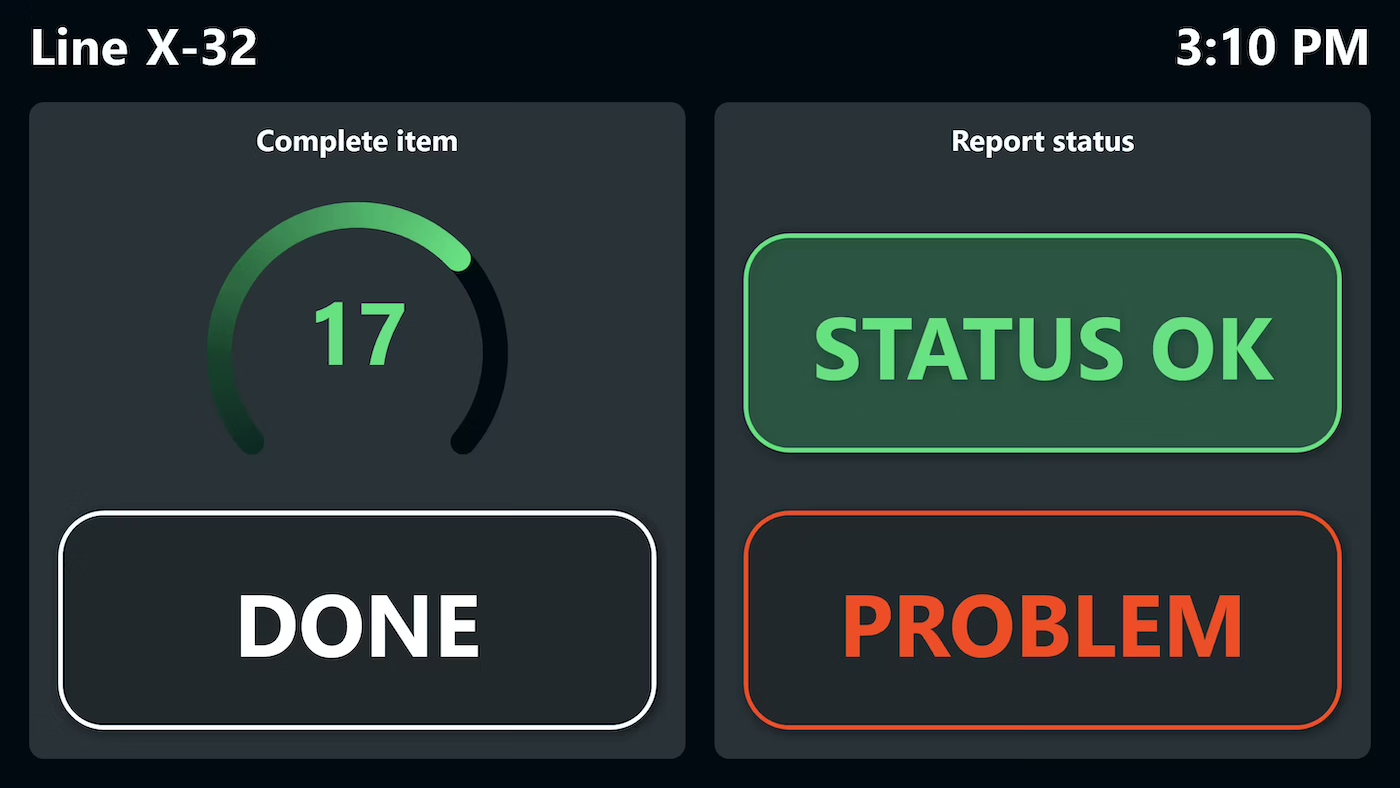
Peakboard simple digital call system showing workplace status with done and problem buttons
Industrial call system
Report faults right at the workstation – the right people are notified instantly and respond faster.
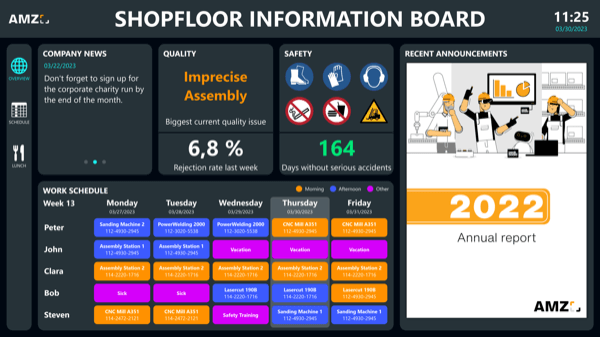
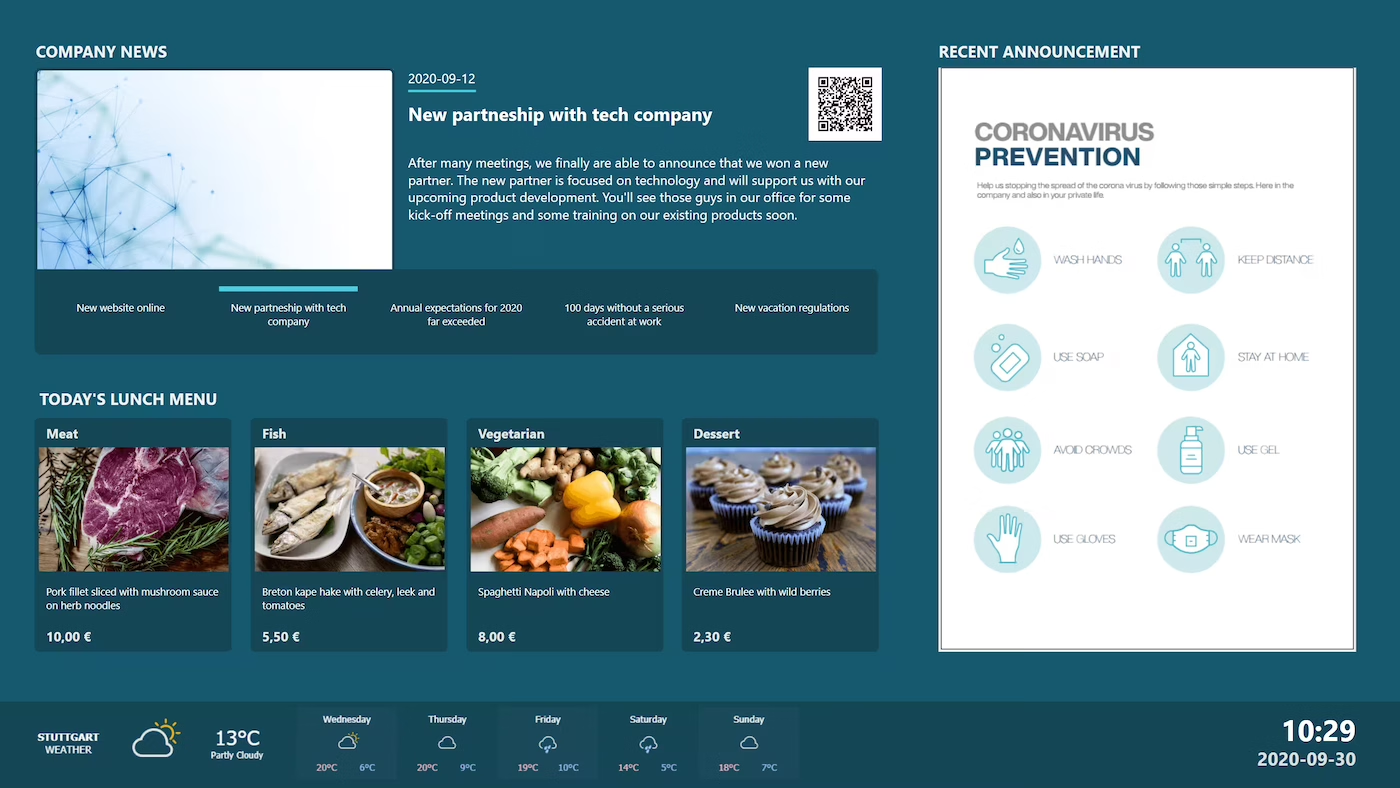
Peakboard digital bulletin board showing shopfloor information with news and calendar
Digital bulletin board
Change it once, everyone sees it instantly – shift schedules, notices and news managed centrally, without the paper chaos.
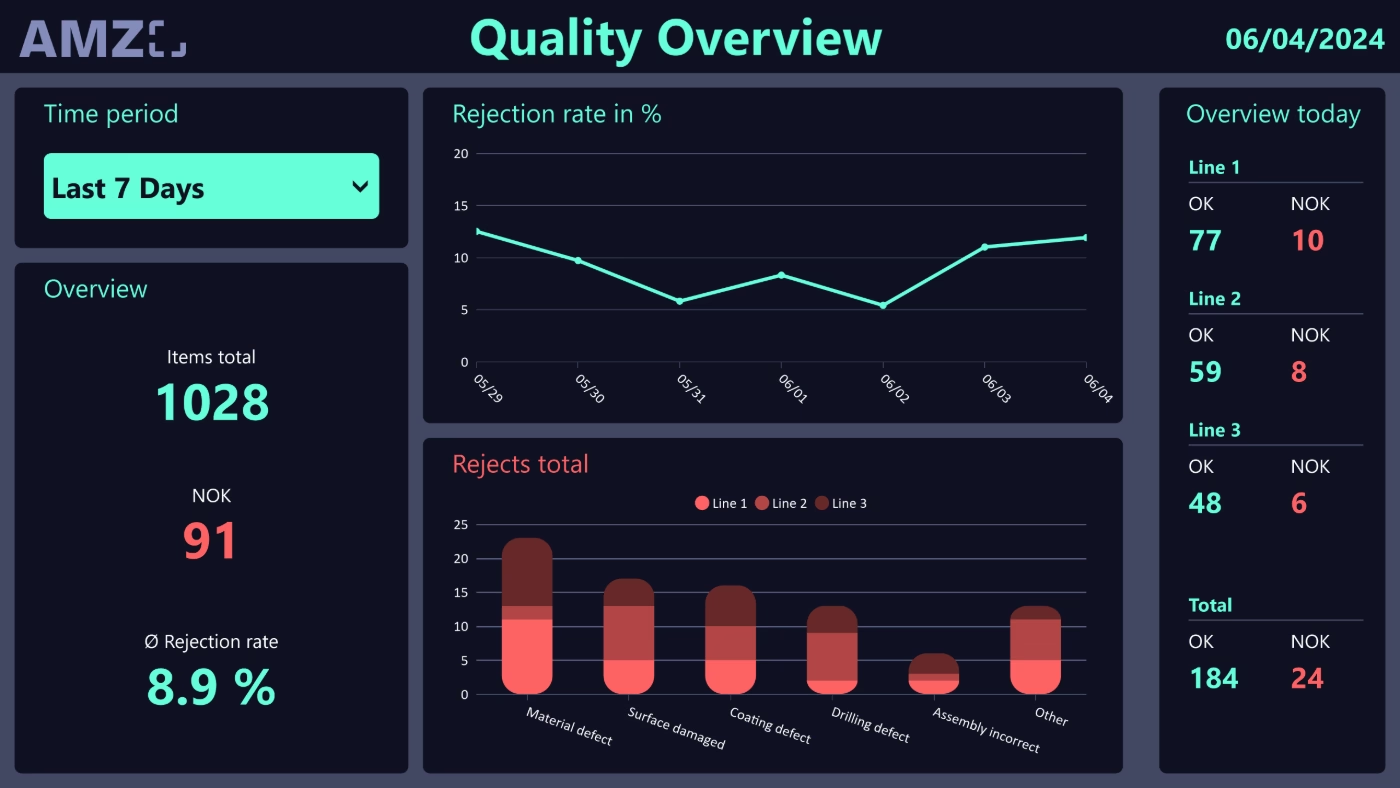
Peakboard quality overview for series production with rejection rate trend, NOK parts and rejects per line.
Series production analysis
Every production step backed by data – detect scrap early, improve OEE, continuously optimise processes.
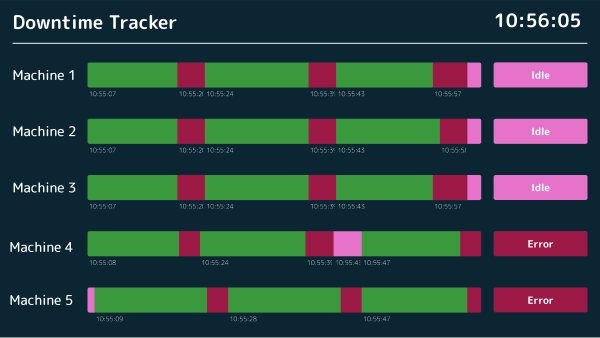
Peakboard downtime tracker showing a timeline per machine with running, idle and error states.
Downtime tracking
Capture machine downtime in real time, analyse root causes and cut outages for good.
Peakboard digital audit reporting app showing a CNC machine safety checklist
Digital audits
Capture, analyse and document inspections, checks and compliance data – paper-free.
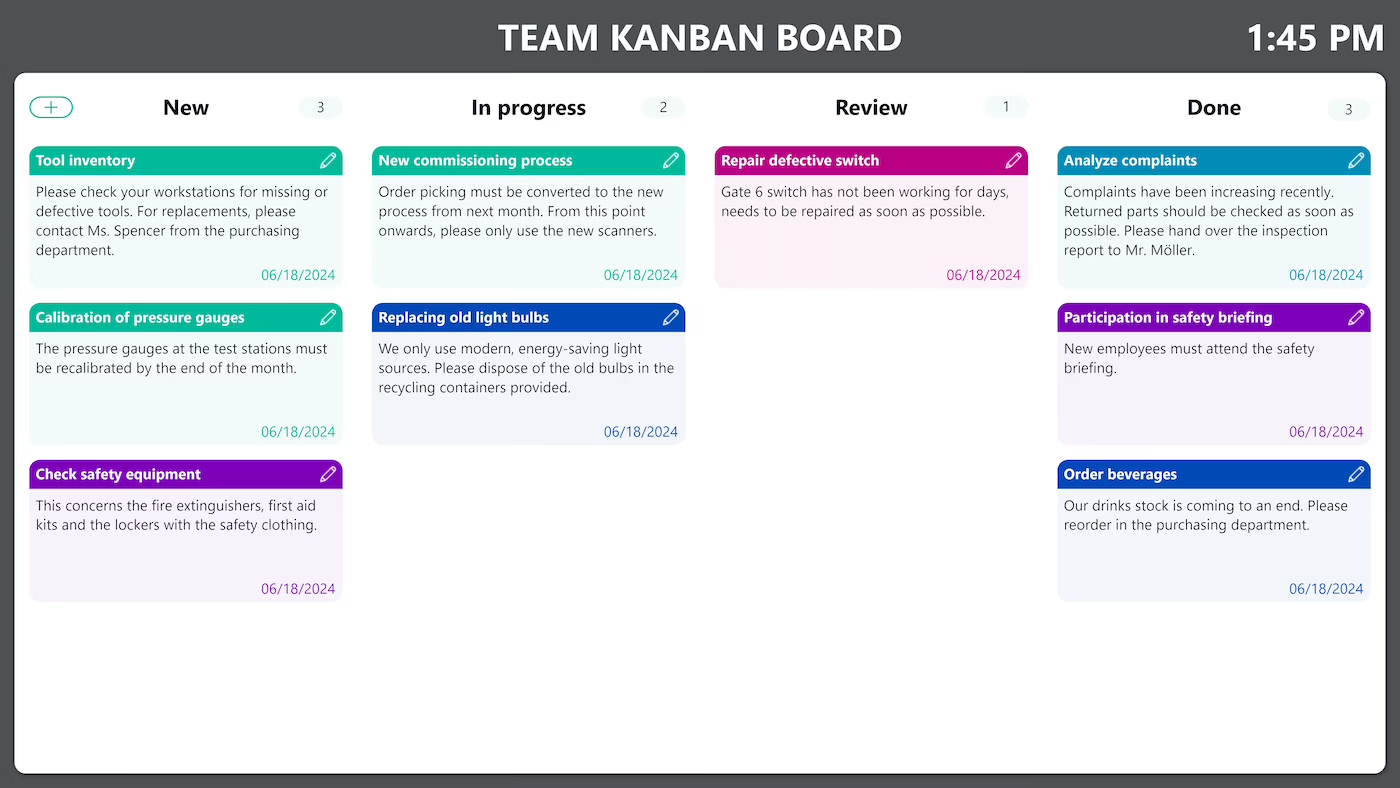
Peakboard interactive Kanban board showing tasks organized in status columns
Digital Kanban board
Visualise tasks and priorities in real time – move cards and add new tasks directly.
Peakboard digital bulletin board with company news, images and documents synced from OneDrive.
Bulletin board with OneDrive
Edit a file in OneDrive, instantly current on all displays – notices and shift schedules without manual upkeep.
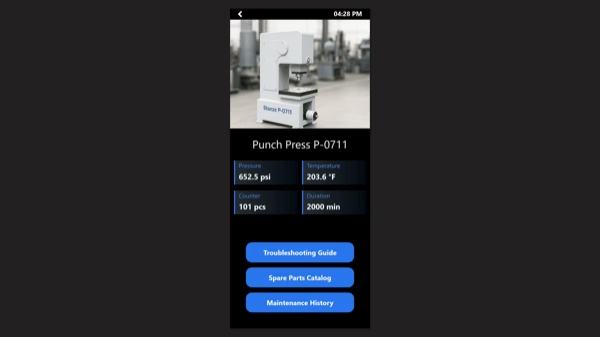
Peakboard handheld app on tablet showing maintenance and repair functions for a punch press machine
Handheld maintenance
Carry out maintenance and repairs right at the machine – open instructions by QR code, document on site.
Peakboard dashboard visualising production data with shopfloor overview and progress tracking
Visualise production data
OEE, scrap and cycle times from single-unit, series and mixed production on one dashboard – decisions based on data.
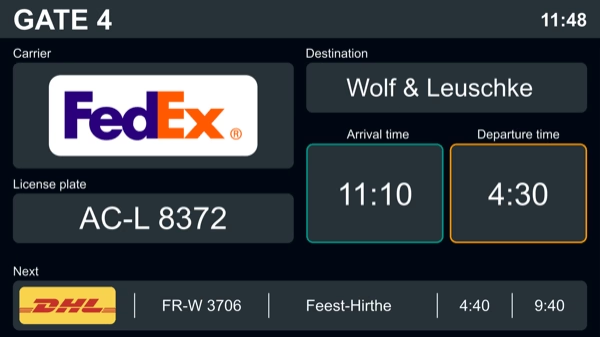
Peakboard gate display for truck handling with carrier, licence plate, destination and arrival and departure times.
Digital warehouse logistics
Goods receipt, stock and dispatch on one dashboard – spot bottlenecks before they disrupt the workflow.
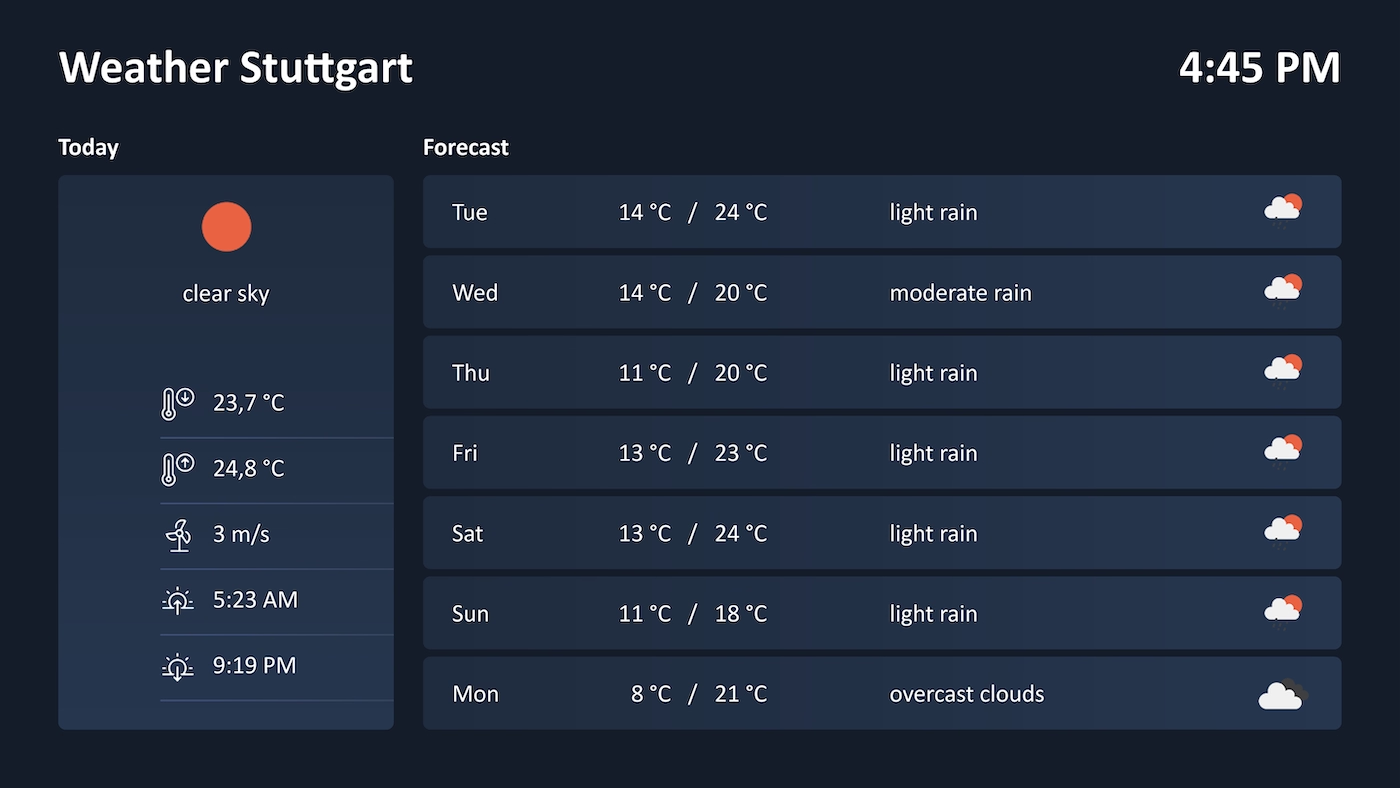
Peakboard weather forecast board with a daily overview, temperatures and weather icons for the plant entrance.
Weather Forecast Board
Current weather data and the forecast for the days ahead – refreshed continuously through the OpenWeather API.
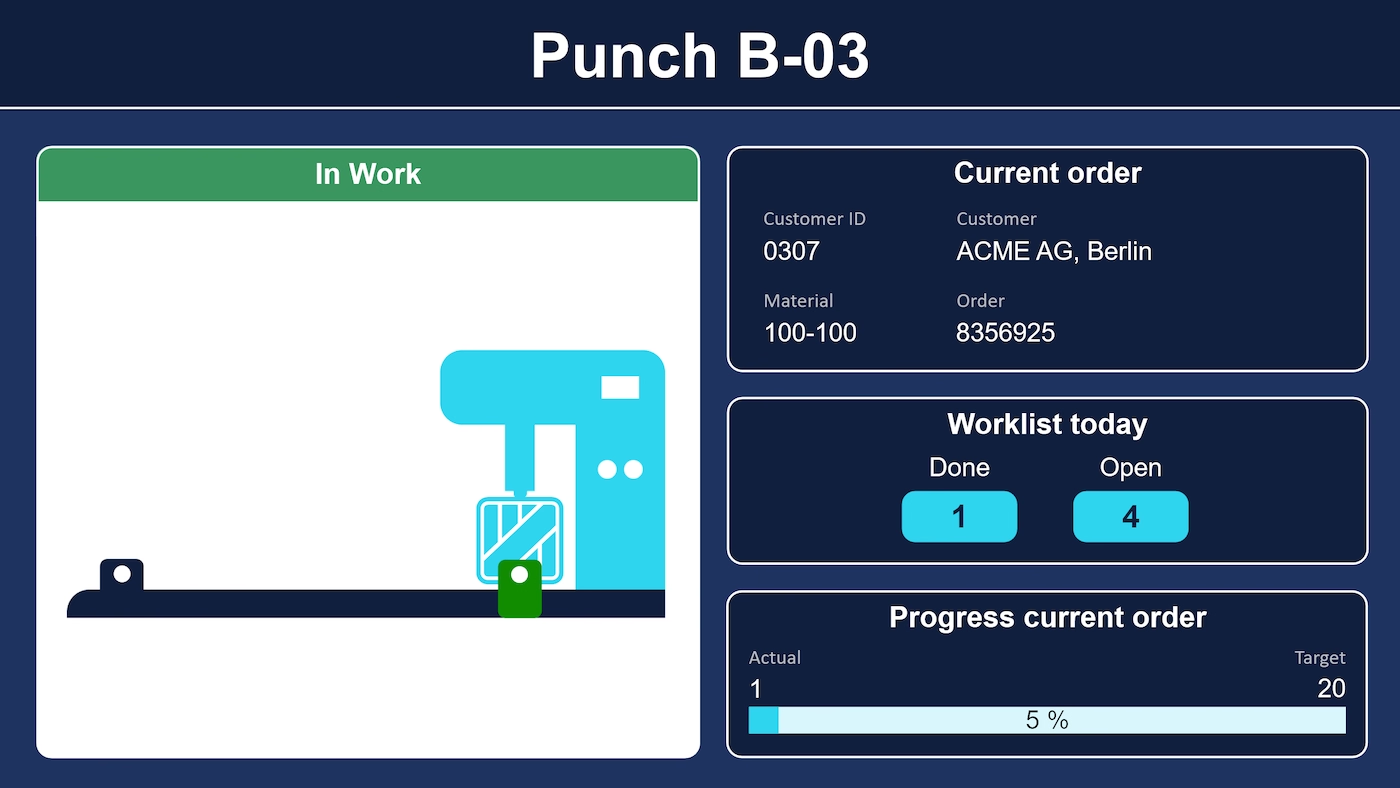
Peakboard control panel for a punching machine, sending commands to a Siemens S7 controller by touch.
Punching Machine Data with Siemens S7
Map a punching machine graphically – with light barriers, punch head, order, workload and progress.
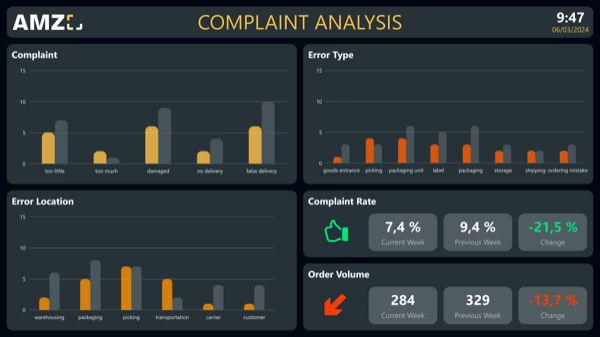
Peakboard complaint analysis dashboard with complaint rates, error types, error locations and order volume.
Complaint analysis
Analyse complaints and defects on a data basis – identify causes and raise quality.
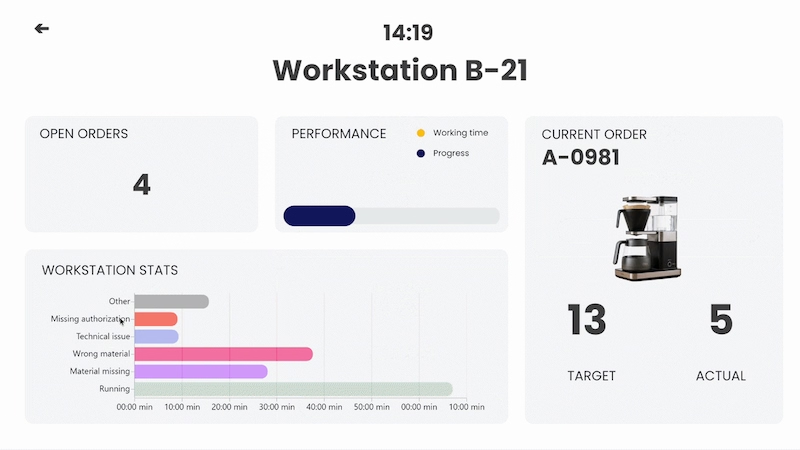
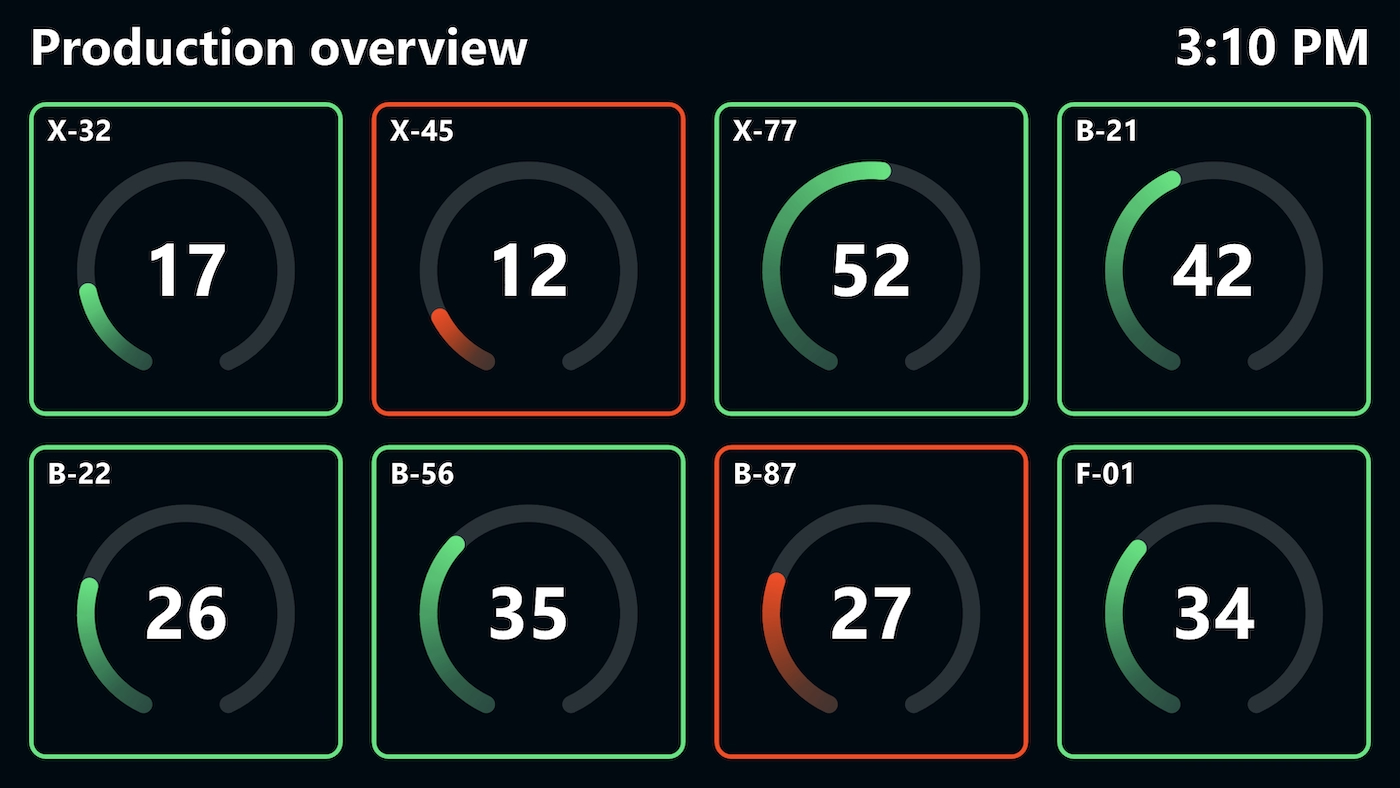
Peakboard dashboard for Workstation B-21 with open orders, performance bar, workstation stats and current order.
Andon Overview with Worker HMI
Workstations as tiles at a glance, issues reported directly by workers – two screens, one system.
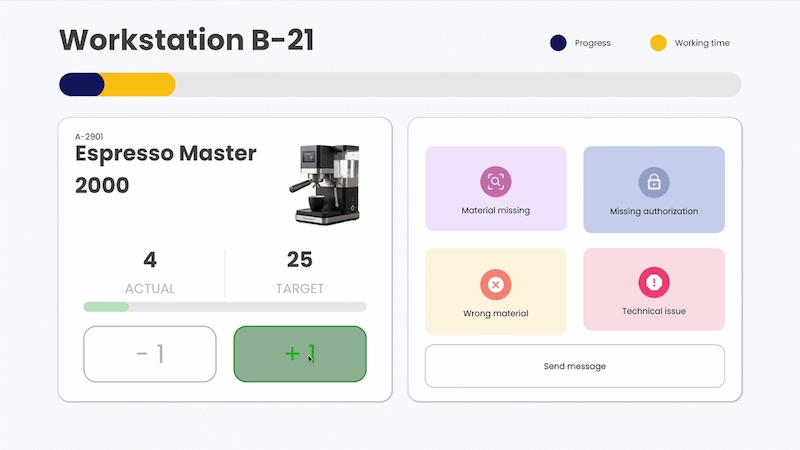
Peakboard touch HMI at Workstation B-21: report parts with plus and minus buttons, plus four fault tiles.
Worker Touch HMI
Select orders, track progress and alert supervisors – right on the workstation touchscreen.
Peakboard order list on a touchscreen where workers report missing parts to intralogistics via MQTT.
Digital Order List with MQTT
Order missing production parts at the push of a button on the touchscreen – reported straight to intralogistics.
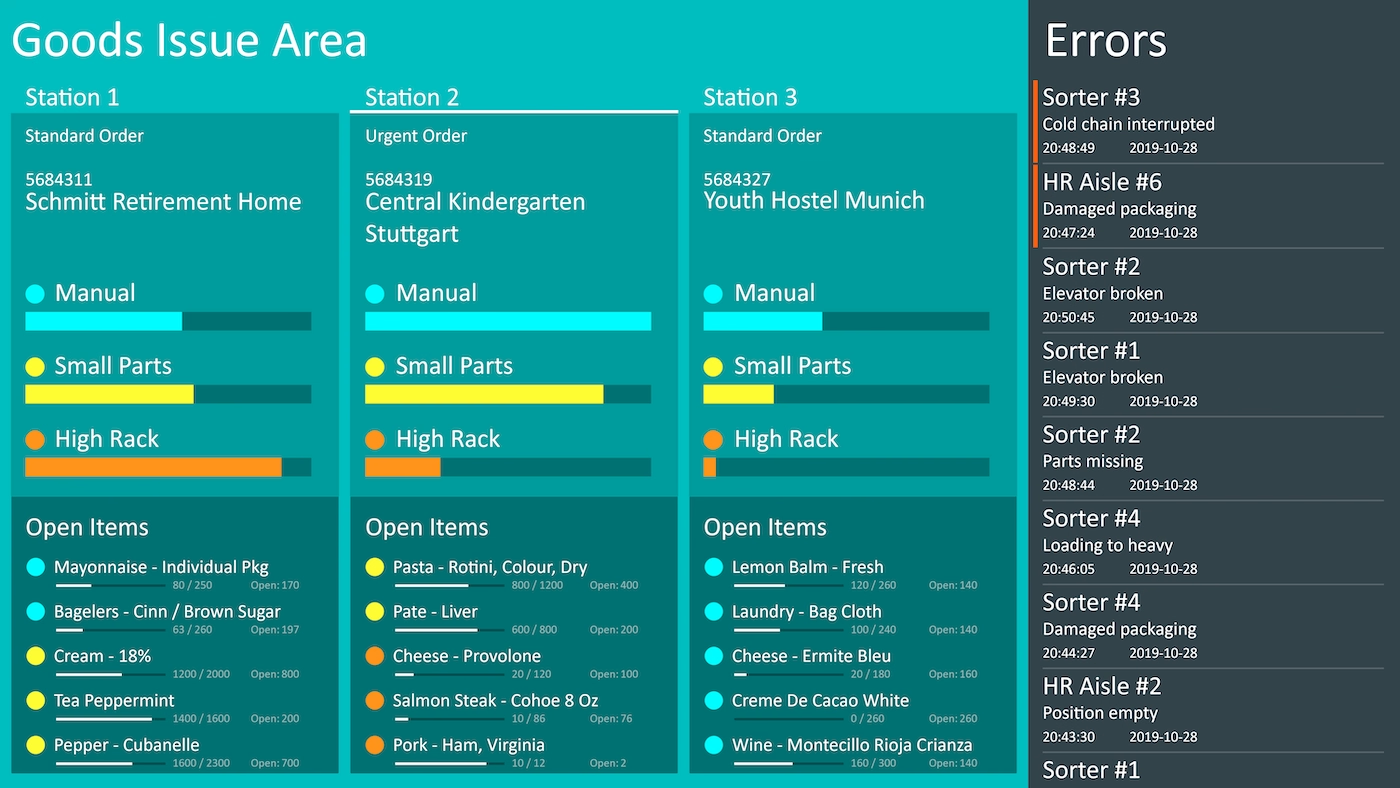
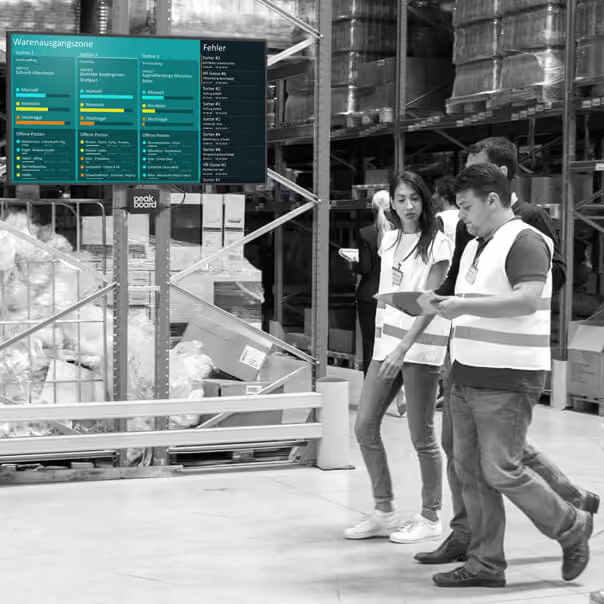
Peakboard goods-issue board showing order status, outstanding items and logistics key figures.
Goods-Issue Board
Track order status in the goods-issue zone, outstanding items per order and progress by storage area.
Peakboard production line overview showing cycle times, quality data and status for each station.
Cycle Status & Quality
Cycle time, quality level and OEE for a production line, live on one screen.
Peakboard dashboard with a drawing of the production line in the background and status per operation.
Production Line Cross-Section
An entire production line on one screen – the operations lit up on a drawing of the plant.
Peakboard overview of completed parts in a target-actual comparison with OEE value and order data.
Target-Actual Comparison
Show completed parts and the target quantity with the difference – plus OEE value, order data and status.
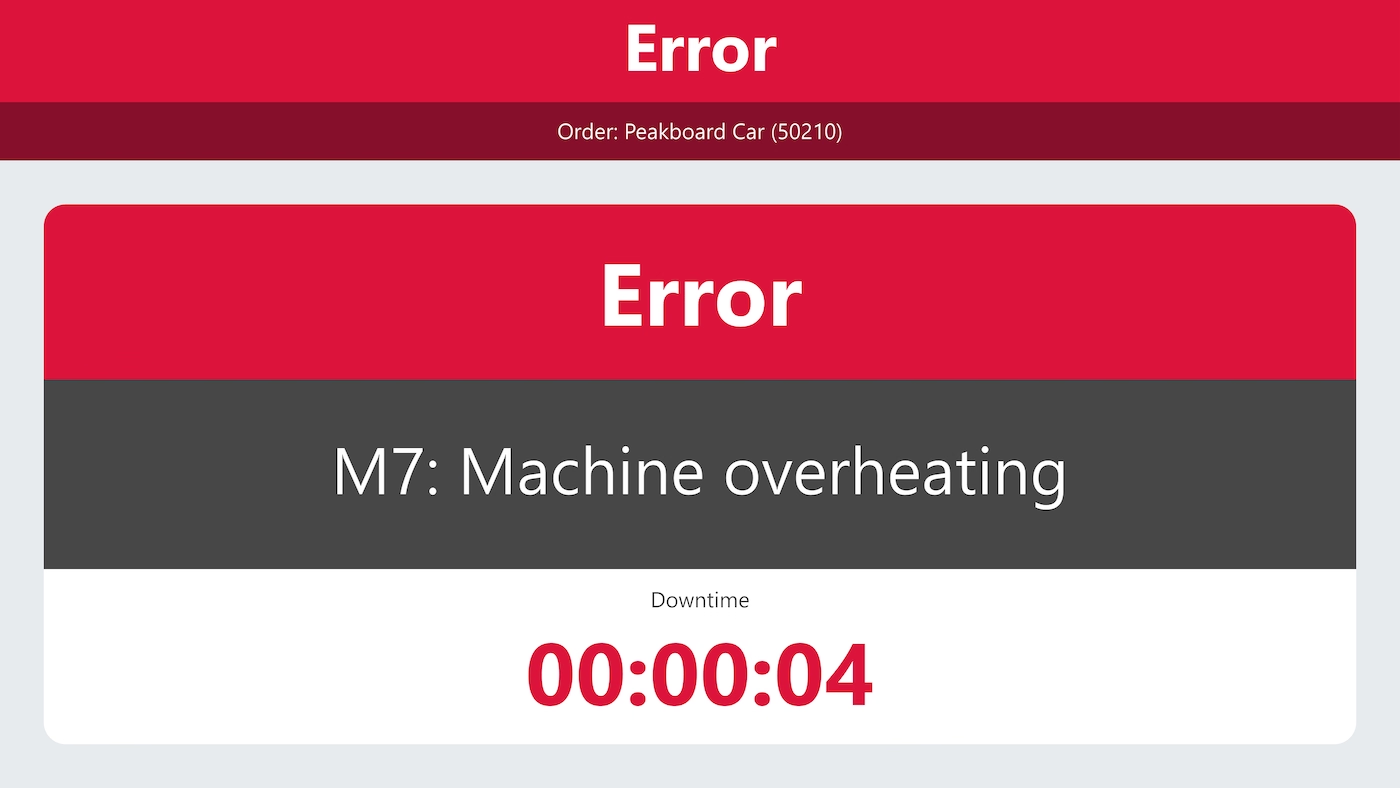
Peakboard alarm monitor displaying production malfunctions in large signal colours for the shop floor.
Alarm Monitor
Show faults and the type of fault message in real time – large and in signal colours.
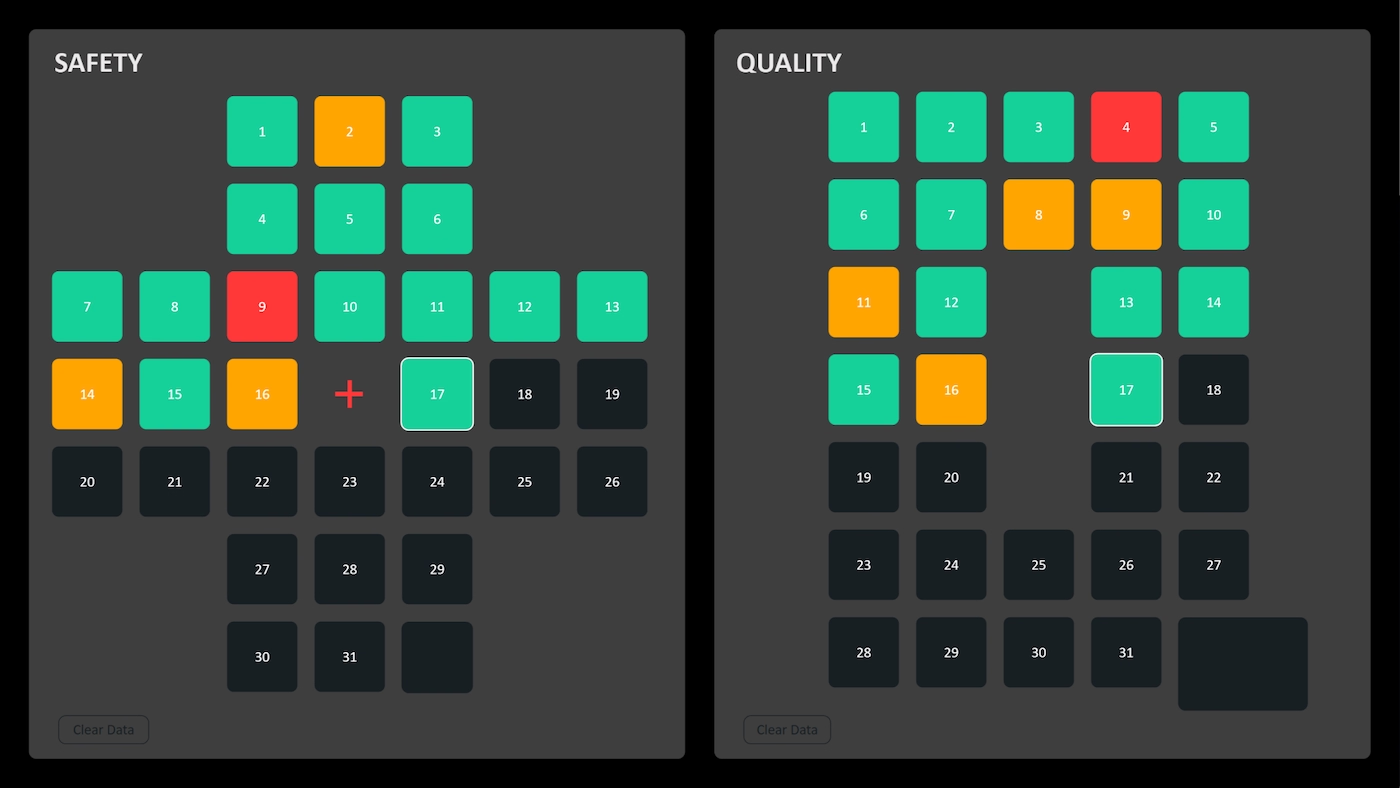
Peakboard Kaizen board with an interactive safety cross and quality Q, rating each day by touch.
Safety Cross & Quality Q
Workplace safety and product quality as a tile view – maintained right on the touchscreen.
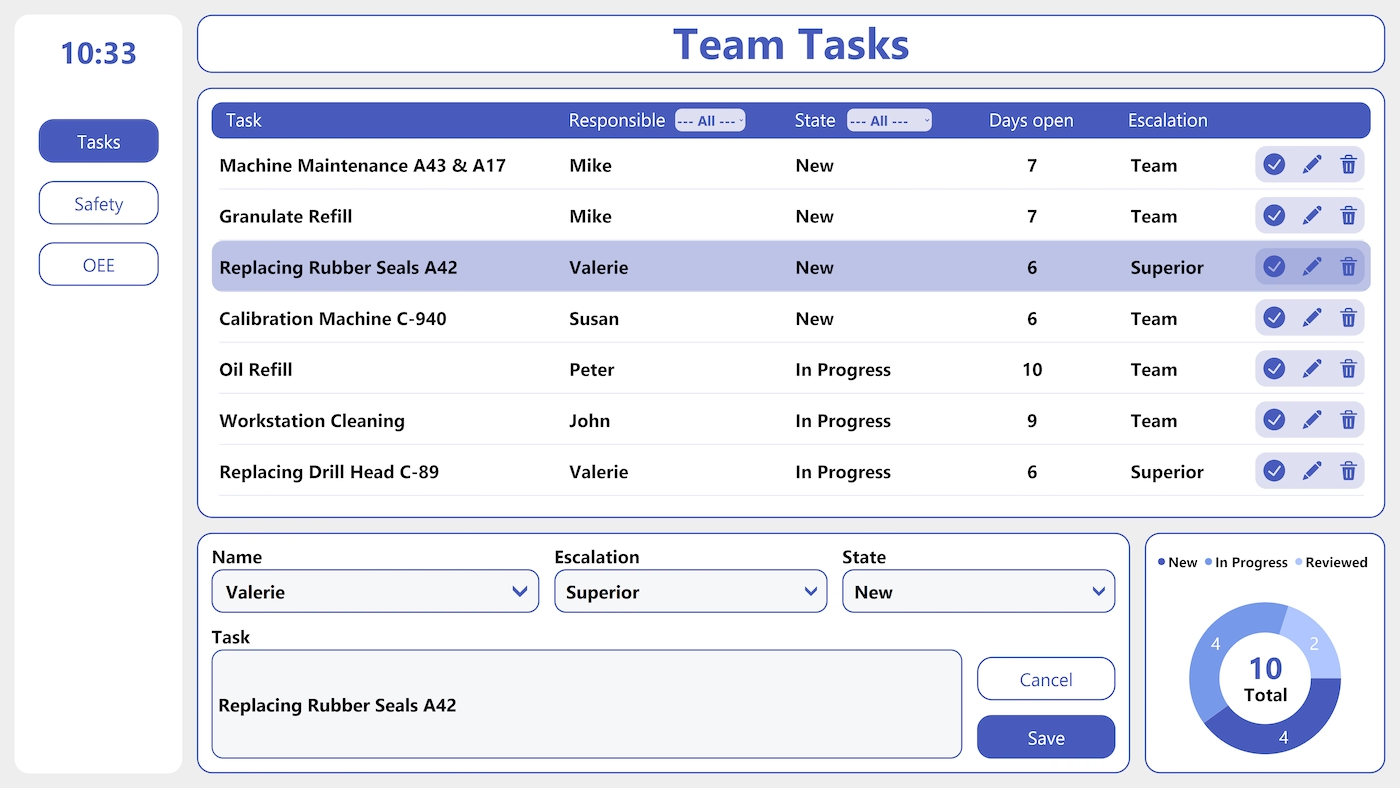
Peakboard team meeting board on a touchscreen for assigning tasks and capturing owners and due dates.
Shopfloor Team Meeting Board
Create, assign and update the team's open tasks – right in the shopfloor meeting.
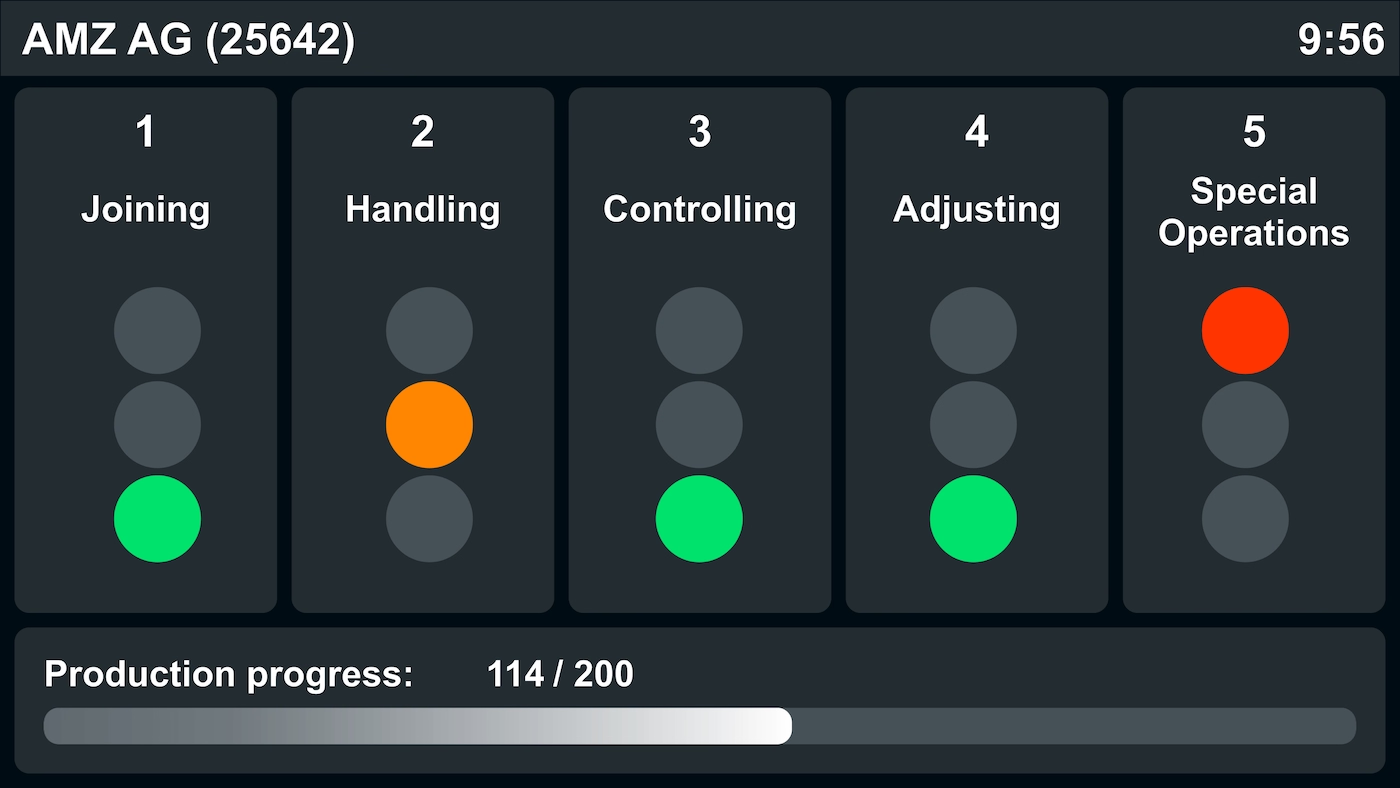
Peakboard Andon board showing live production step status in traffic-light colours per station.
Andon Board for Production Steps
An order's production steps in the traffic-light scheme – with the order status in real time.
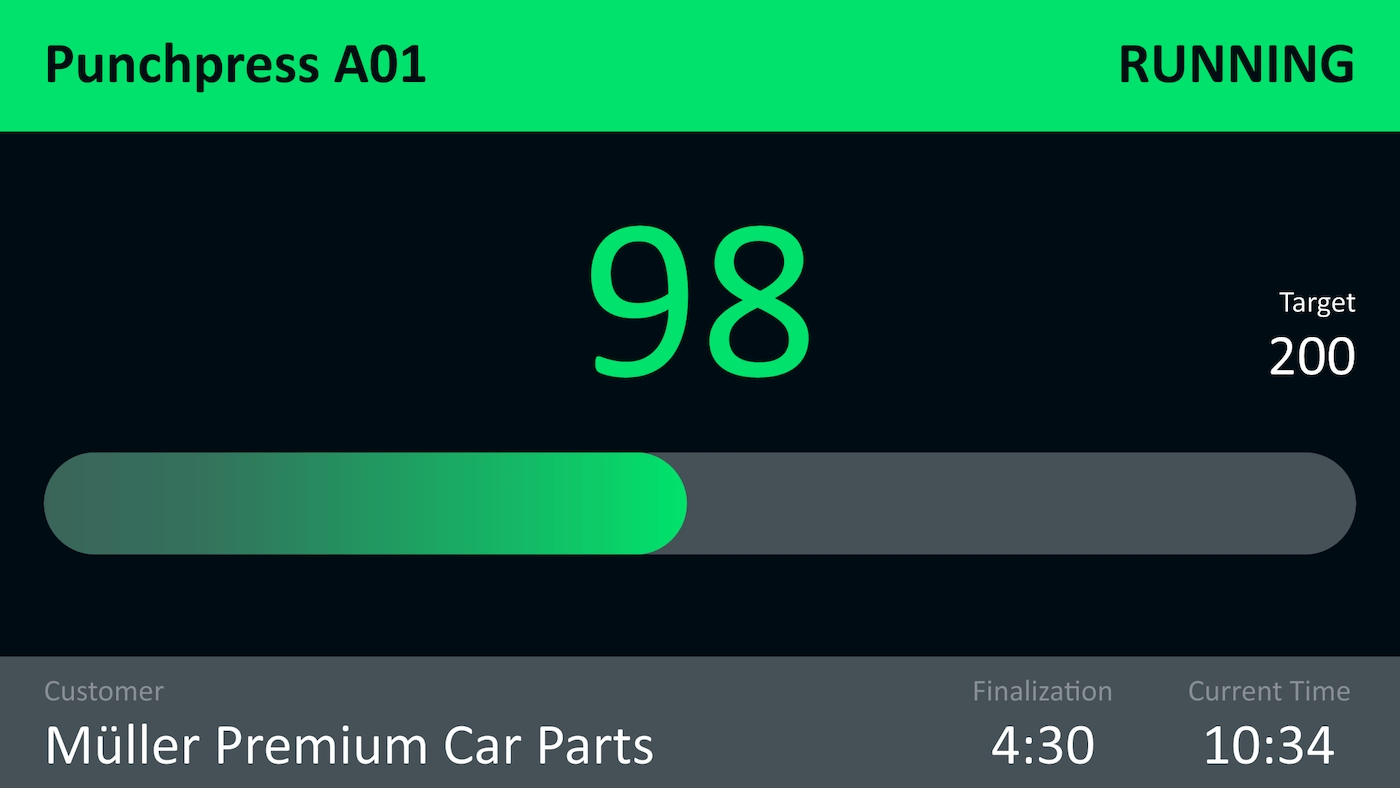
Peakboard customer order progress display with a target-actual comparison and part counts in real time.
Customer Order Progress
Show the manufacturing status of a customer order in real time – as a target-actual comparison and with machine status.
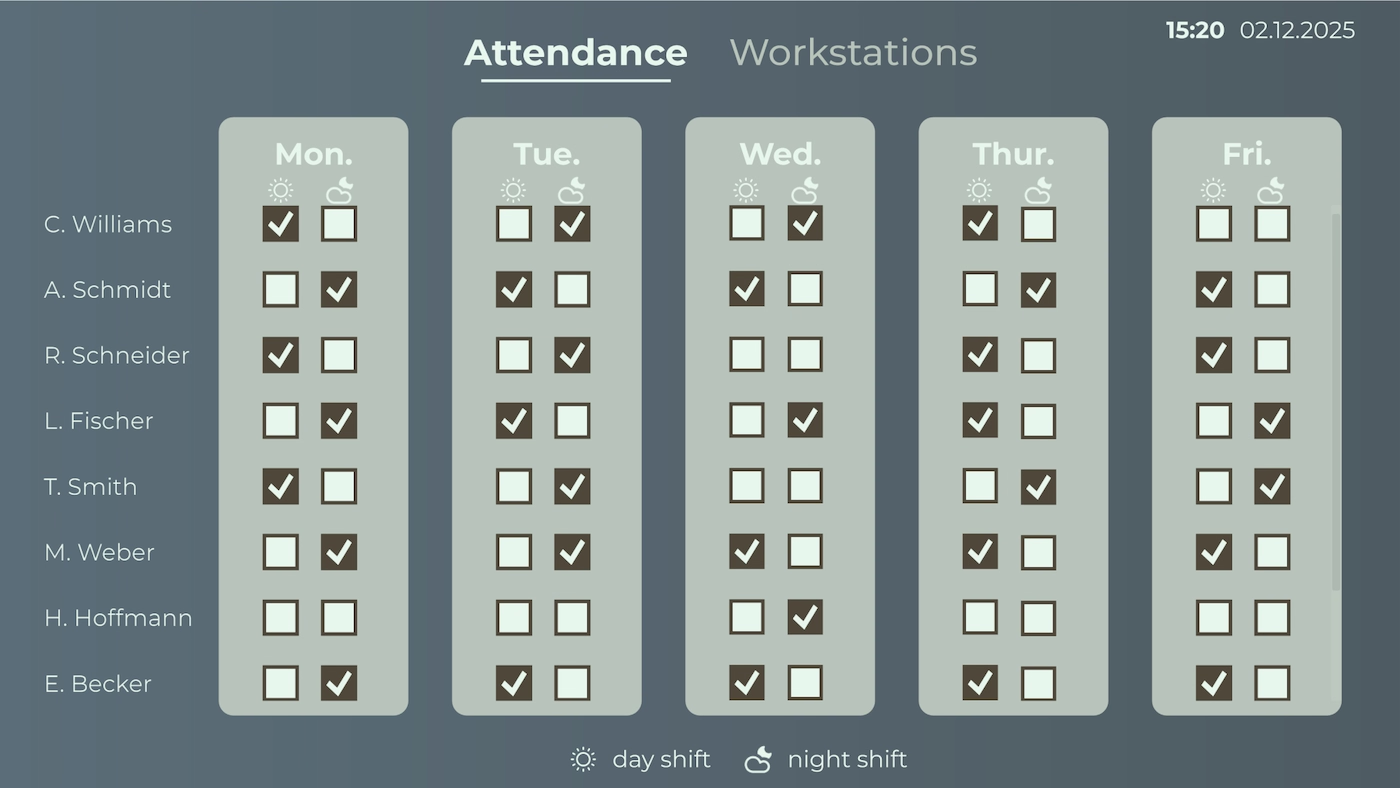
Peakboard attendance board showing weekly staff check-ins ticked off for day and night shifts.
Simple Shopfloor Board
Attendance planning for the week and the production quantity of five machines in one application.
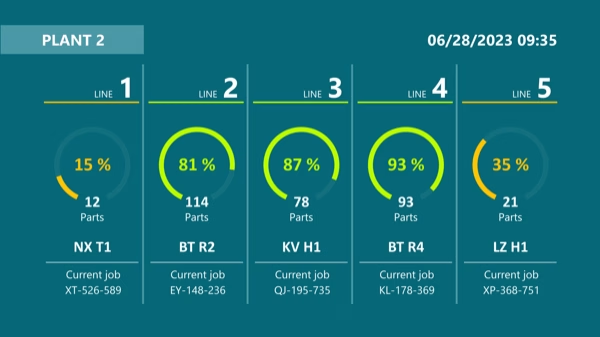
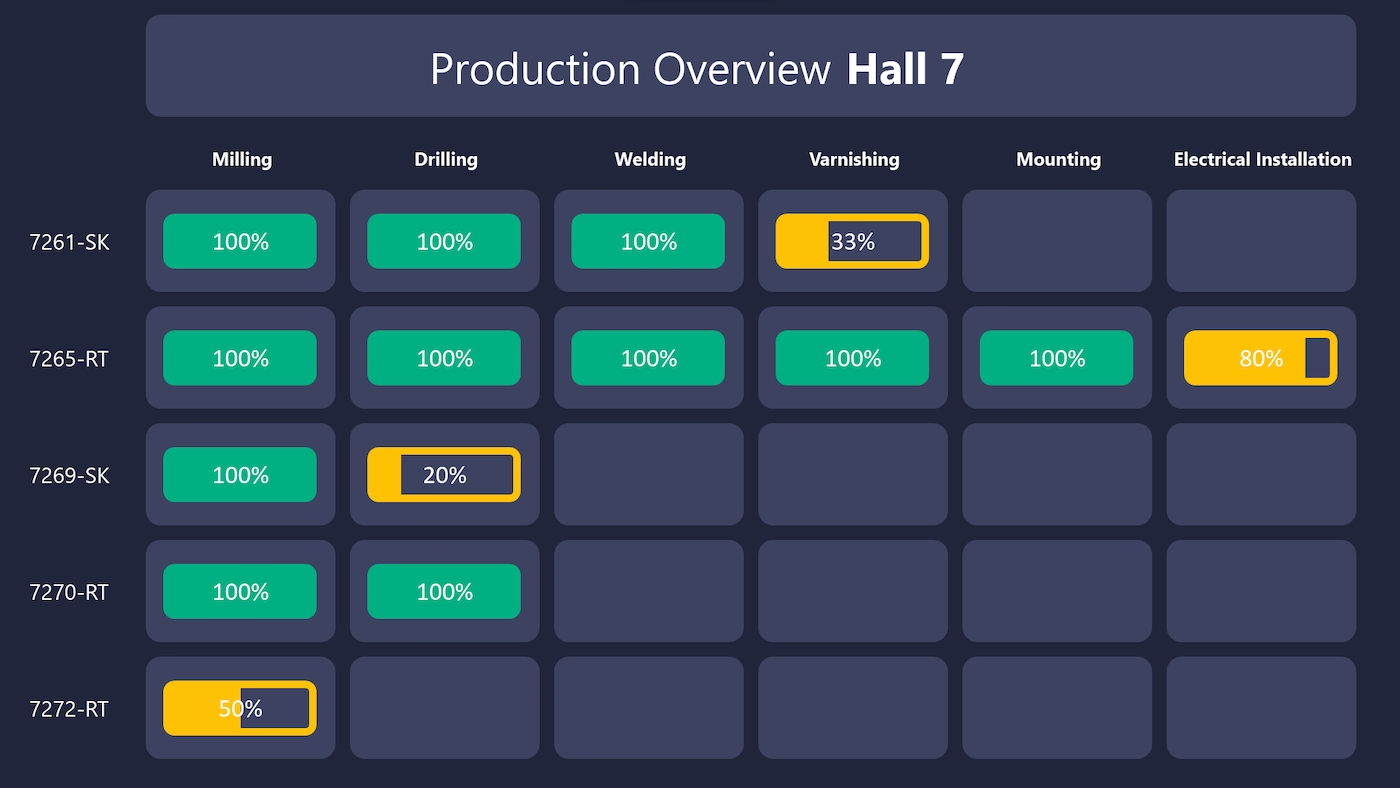
Peakboard status overview of several production lines with progress and key figures from a SQL database.
Multi-Line Status Overview
Show the status of several production lines clearly – with the progress of every operation.
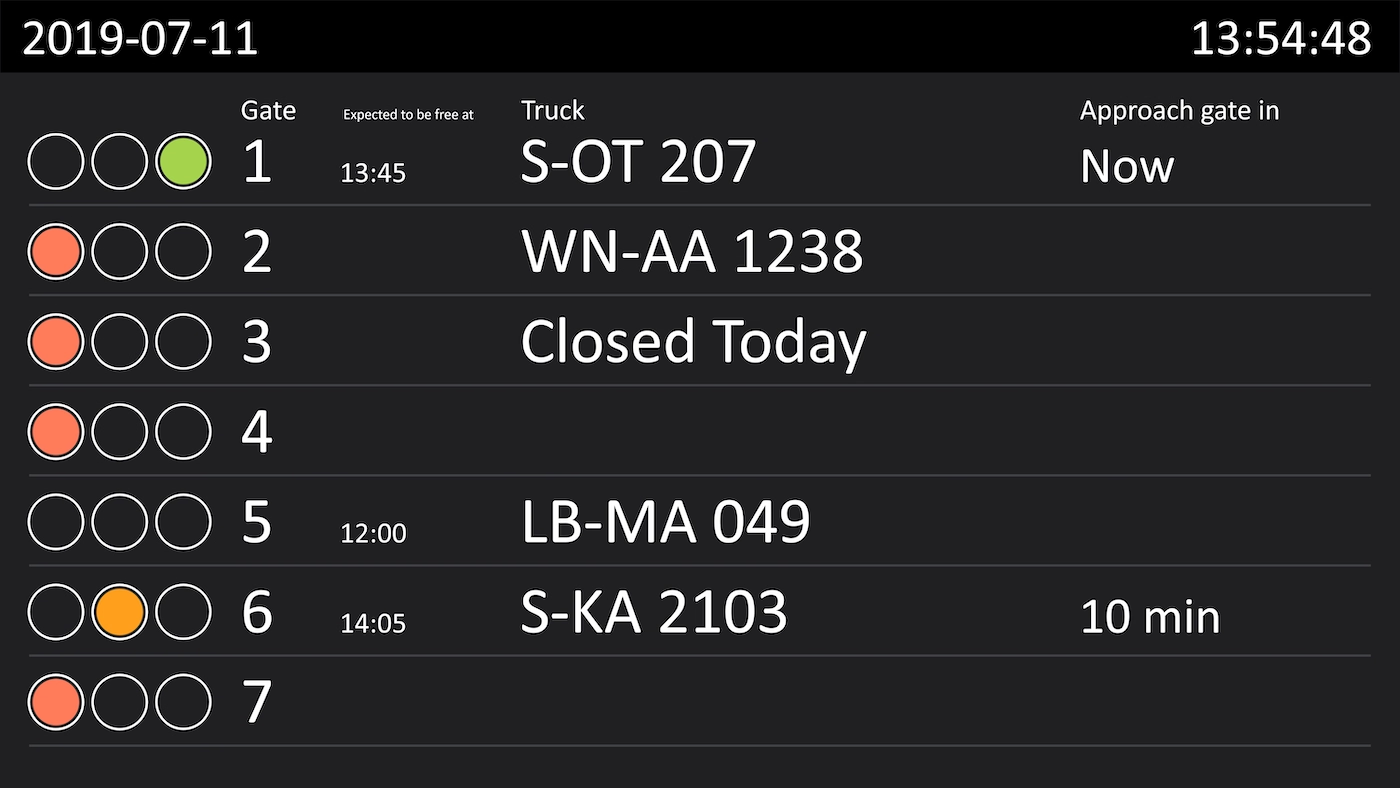
Peakboard loading bay assignment board showing bays, expected lorries and status for each loading point.
Loading Bay Assignment
Assign lorries to a bay and time slot – maintained through the web interface on the Peakboard Box.
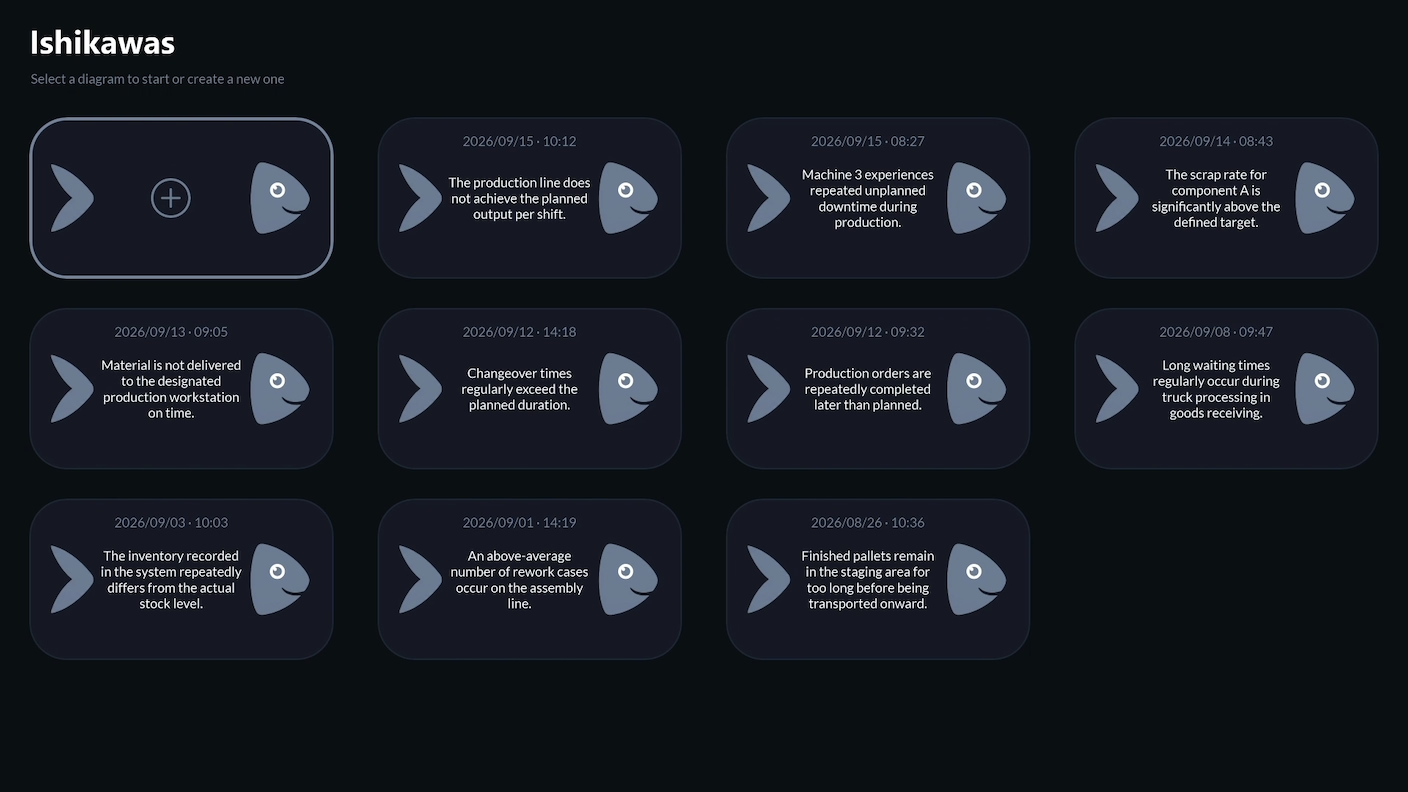
Peakboard Ishikawa board on screen: overview of saved cause analyses with date and problem description.
Interactive fishbone diagram
Gather the possible causes of a recurring fault as a team and sort them into the six categories on the board.
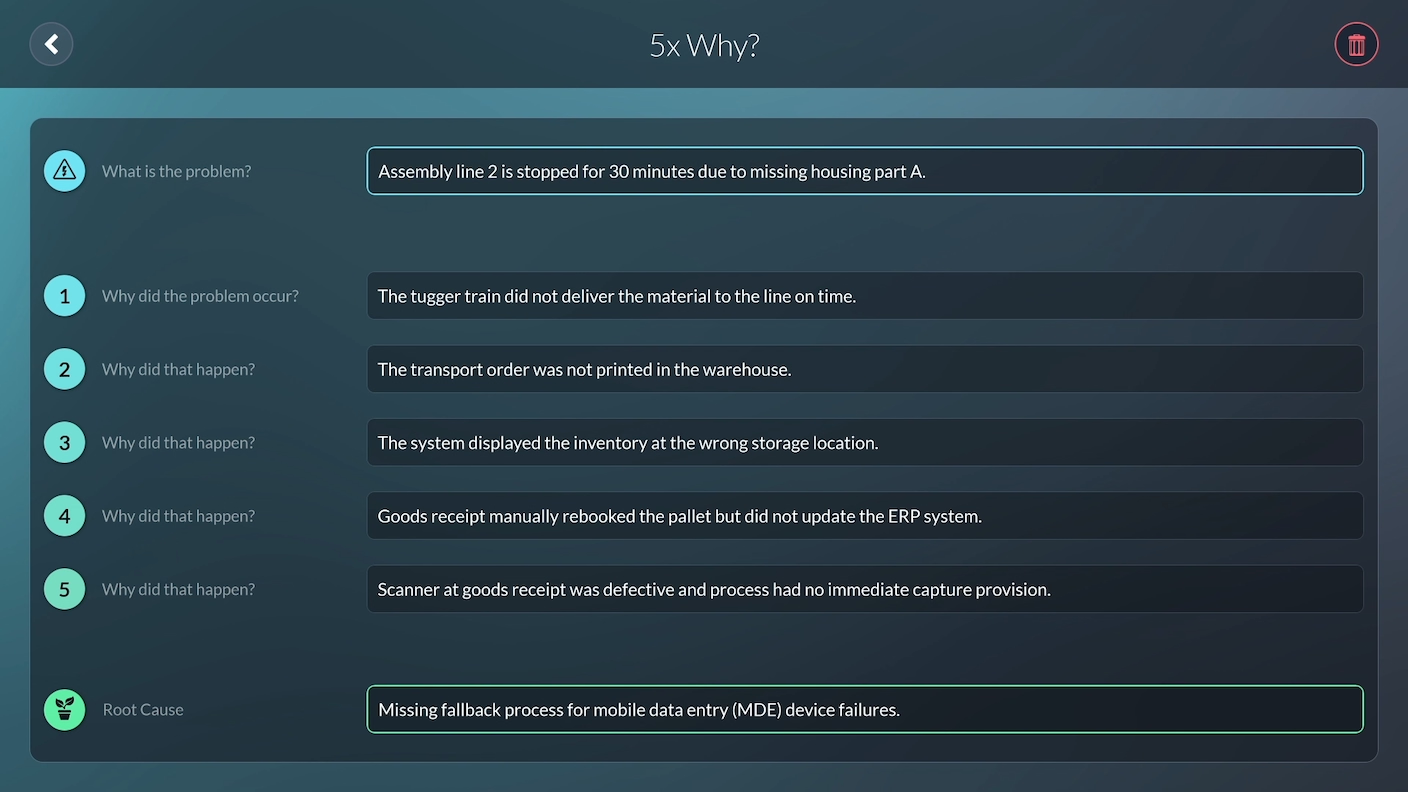
Peakboard 5 Whys analysis on screen: problem, five why answers and root cause in the input fields.
Digital 5 Whys analysis
Keep asking why until the root cause is clear – and record every answer right on the board.
Peakboard dashboard visualising real-time truck parking availability across warehouse buildings.
Parking space management
Detect free spaces via AI camera, display them on screens – no expensive sensors, no search traffic.
Peakboard forklift dispatch system for planning and assigning driving orders across the forklift fleet.
Forklift Dispatch System
Create, assign and track driving orders – for your entire forklift fleet.
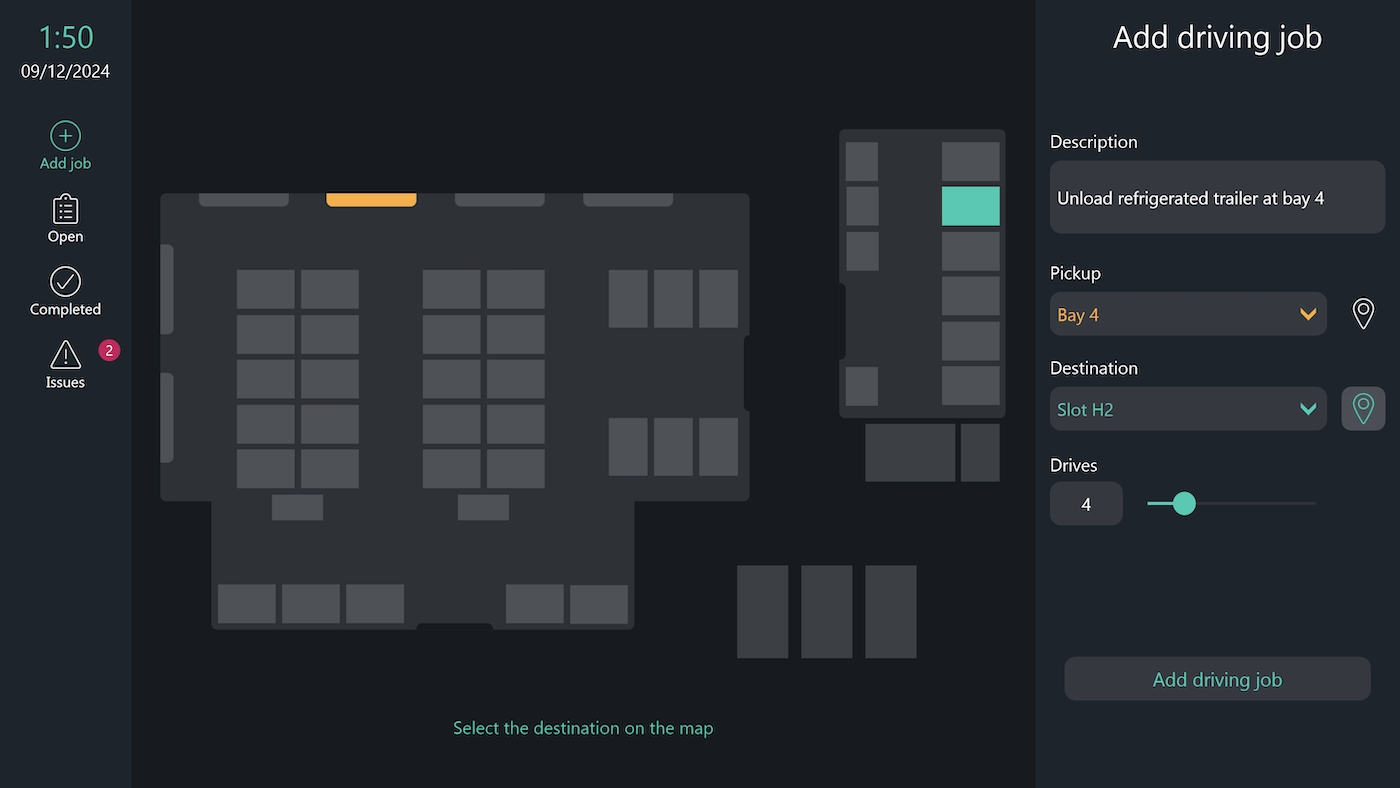
Peakboard forklift terminal for accepting and completing driving orders by touch on the forklift.
Forklift Terminal
Accept driving orders right on the touchscreen, see the destination on a map, and report issues instantly.
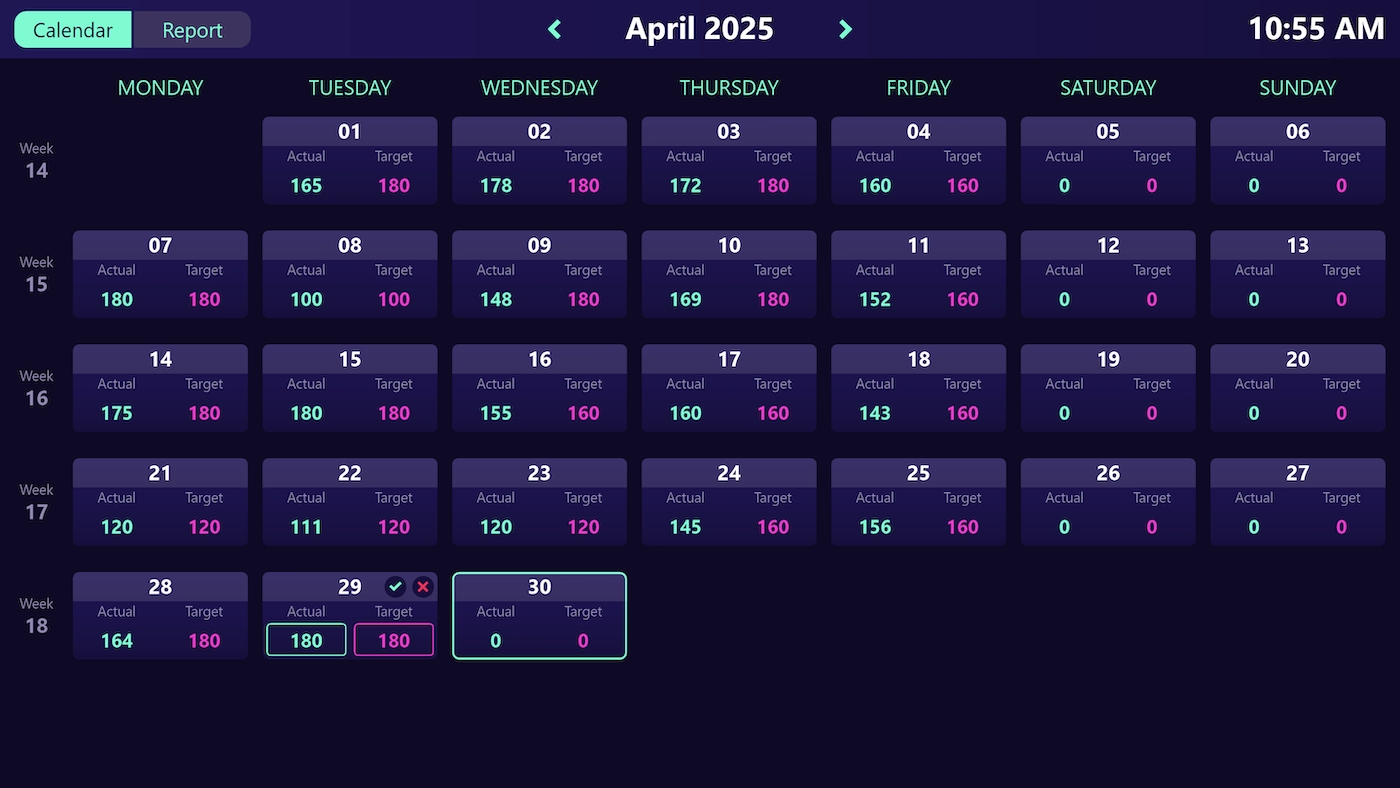
Peakboard calendar view on a touchscreen for capturing and analysing production metrics day by day.
Target-Actual Calendar
Capture production metrics daily, keep them in a calendar view, and analyse by week, month, or quarter.
Peakboard board for tracking work steps: production steps with progress and sub-steps to tick off.
Work Step Tracking with SQL
Follow the work steps of an order live and tick them off on the touchscreen – written straight back to the SQL database.
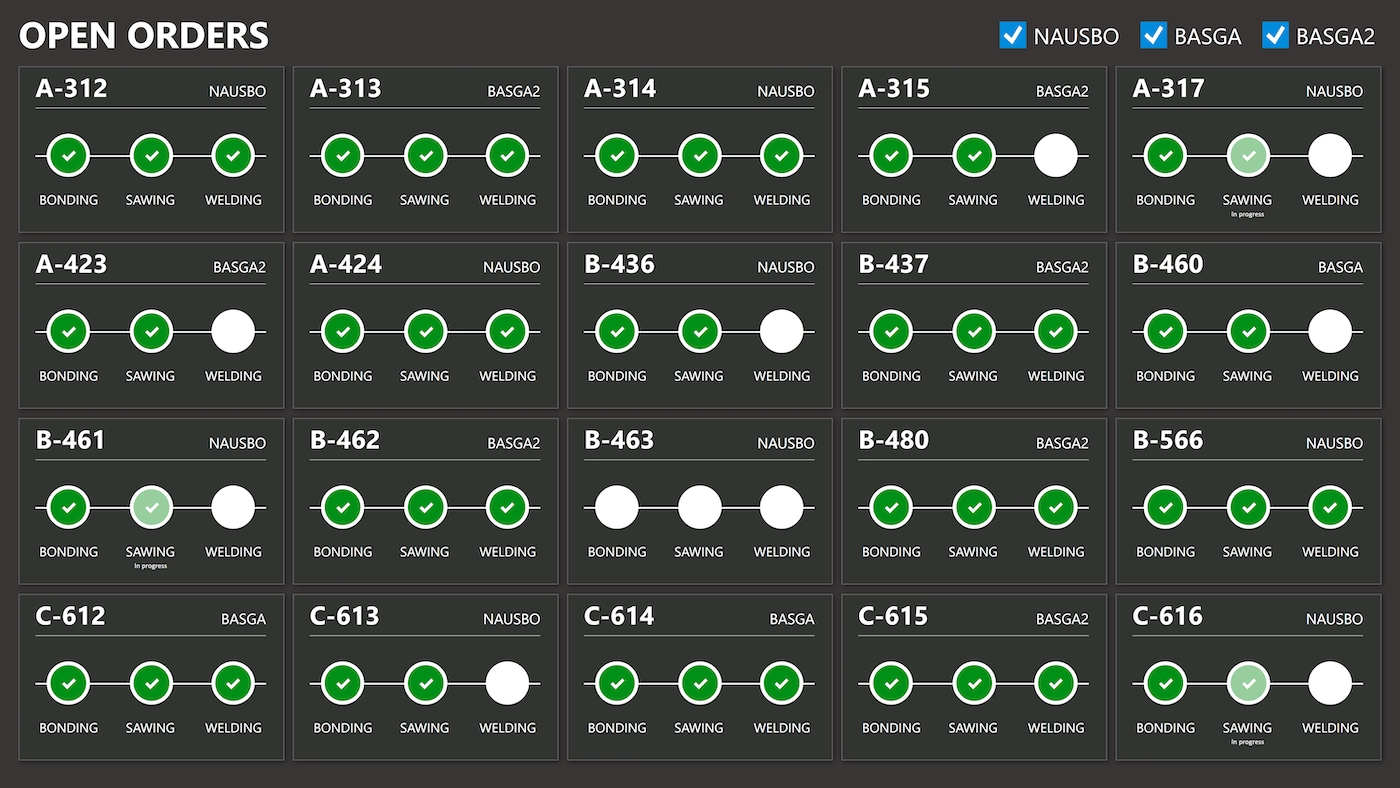
Peakboard overview of open production orders showing progress per work step.
Order Status Overview
Show open production orders with progress per work step and filter them right on the touchscreen.
Peakboard call system overview with workstations, triggered calls and colour-coded status per station.
Digital Call System – Overview
Every workstation with its part count in one view – reported problems visible immediately.
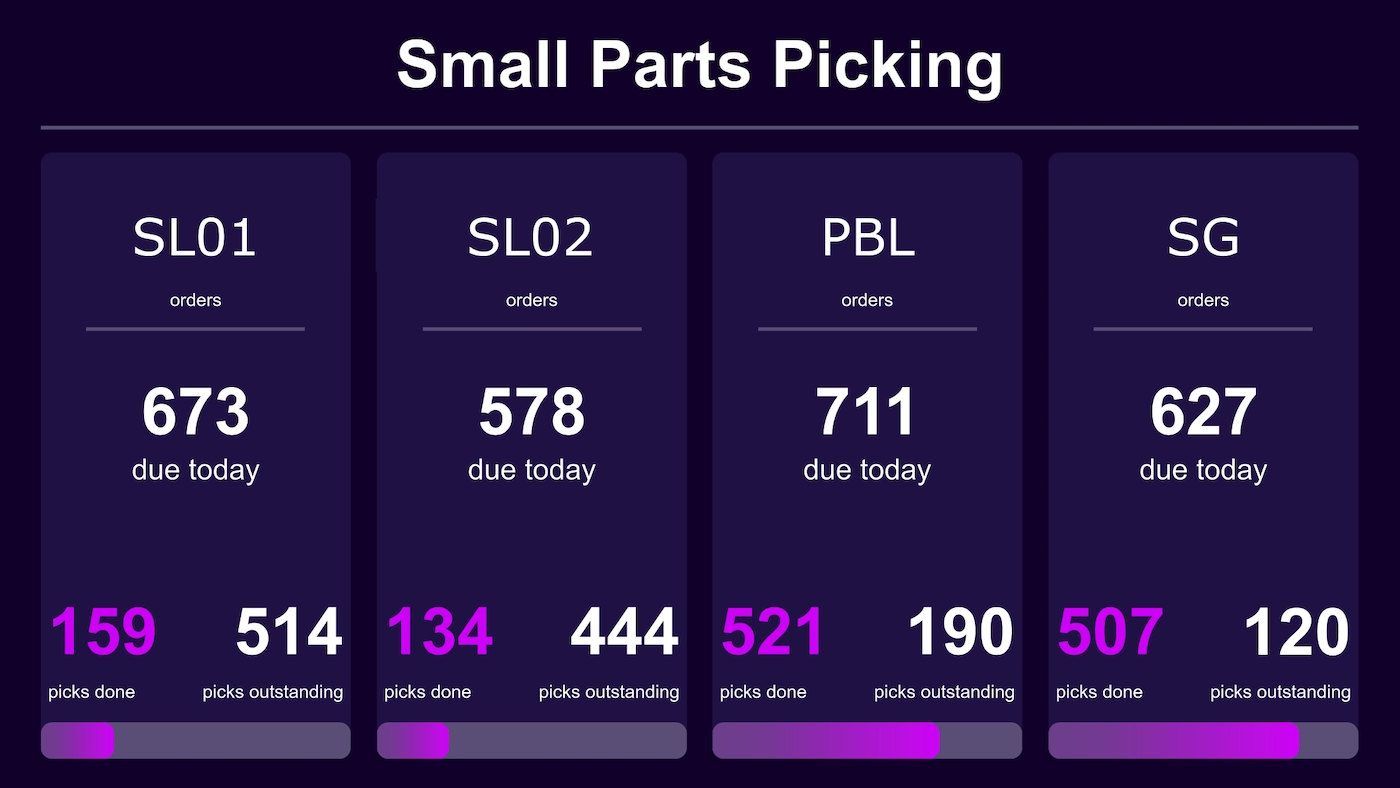
Peakboard small parts picking board showing warehouse workload, stock levels and fill levels per container.
Small Parts Picking
Monitor warehouse utilisation – with stock levels and order information in real time.
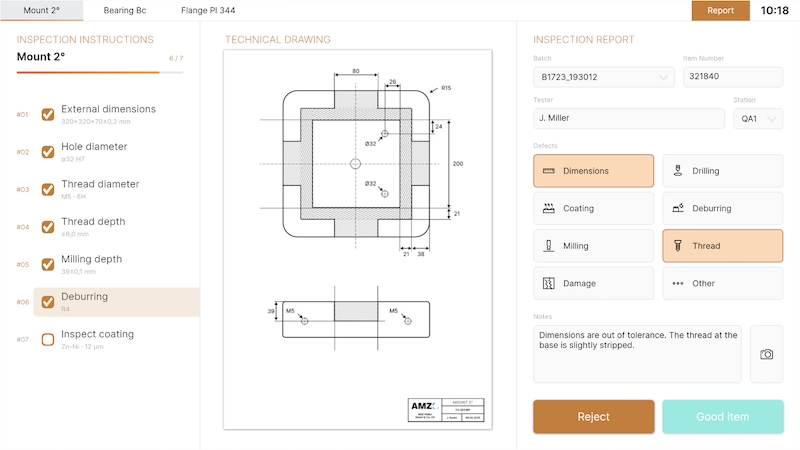
Peakboard quality inspection application with inspection instructions, technical drawing and inspection report.
Digital Quality Inspection
Inspection instructions and technical drawing at the station – with digital inspection reports and reporting.
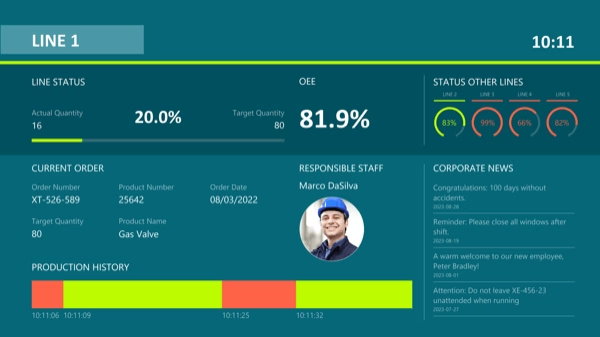
Peakboard detail view of a single production line with OEE, progress, responsible person and status history.
Lean management board
All your lean KPIs at a glance – reduce waste and spot bottlenecks early.
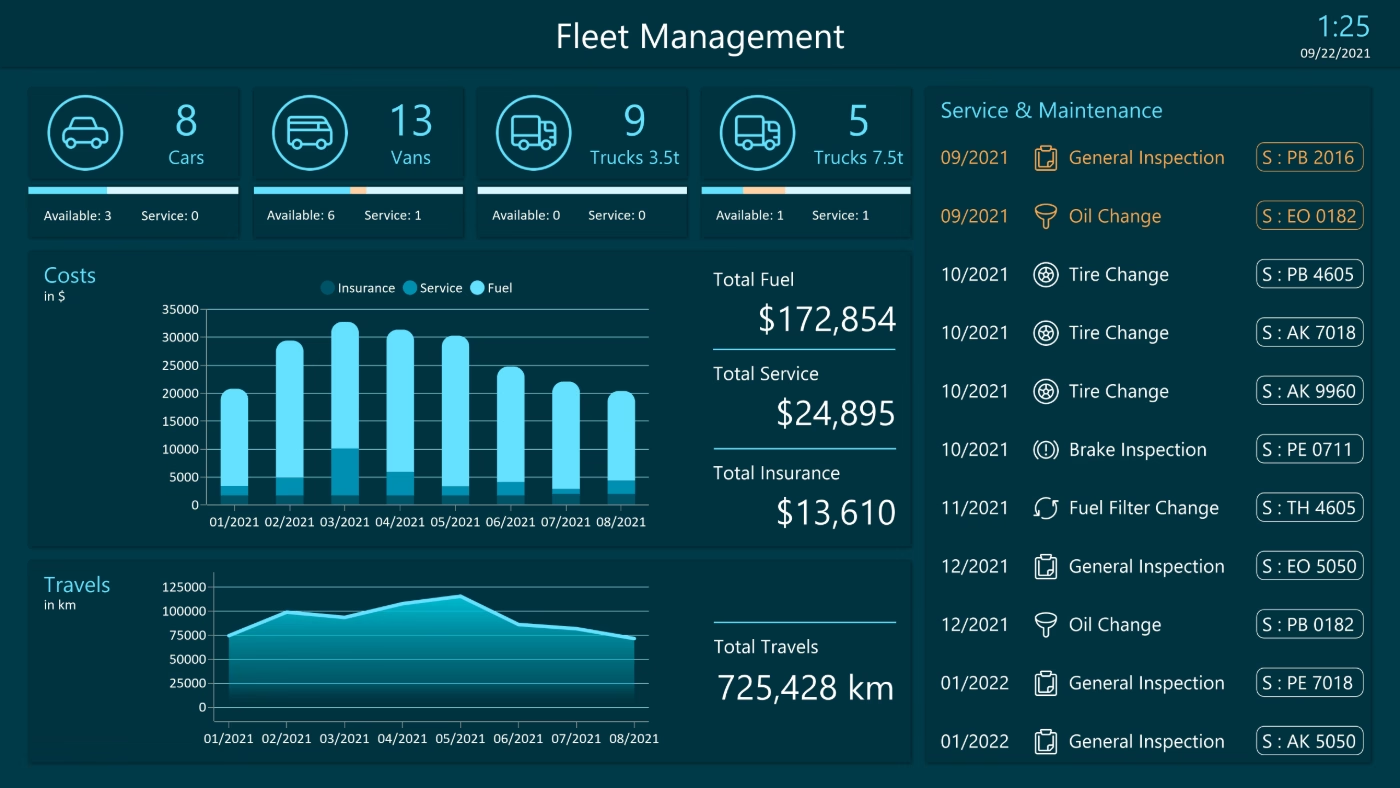
Peakboard fleet management dashboard with vehicle status, costs, trips and upcoming service and maintenance dates.
Digital fleet management
Every vehicle, every deployment, one dashboard – detect maintenance needs early and plan routes better.
Peakboard digital bulletin board displaying company news and weekly lunch menu
Digital employee notices
One notice for all displays – update shift schedules, news and menus centrally, visible everywhere straight away.
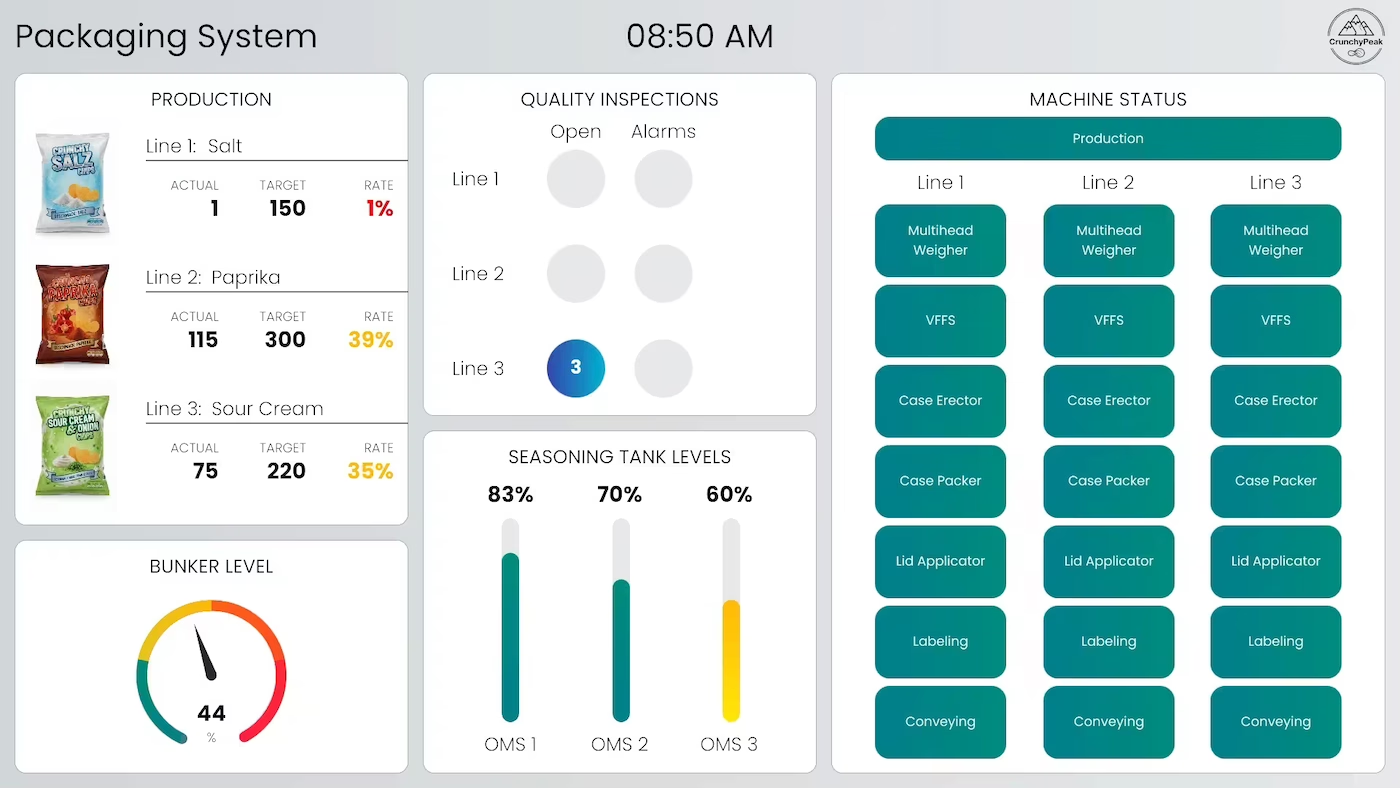
Peakboard dashboard monitoring food packaging lines with production and quality KPIs
Packaging line monitoring
Fill levels, machine status and production progress of the packaging line on one dashboard – spot disruptions before they stop the line.
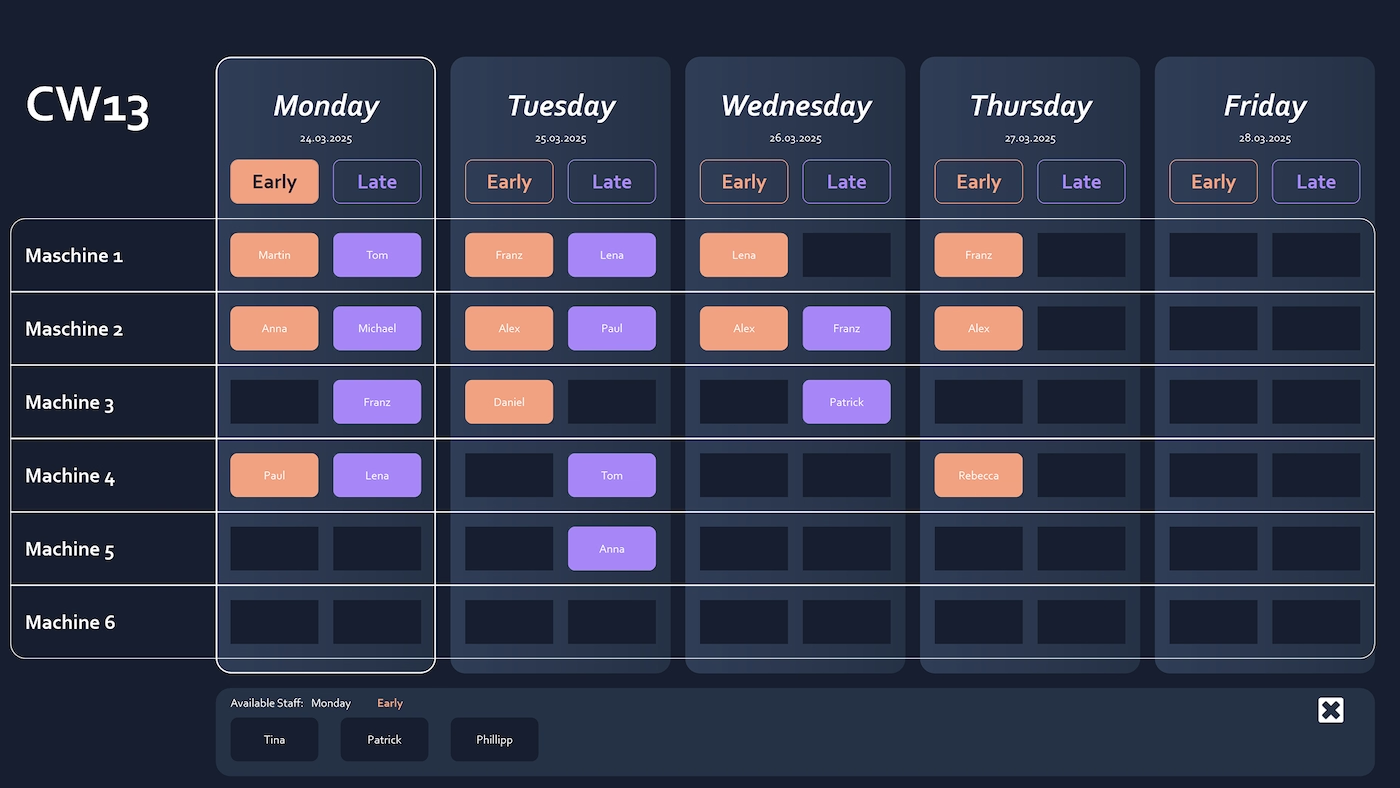
Peakboard shift scheduling board for assigning staff visually and adjusting the plan by touch.
Shift Scheduling
Assign staff to shifts by drag-and-drop – every change is visible to everyone straight away, with no reprinting.
Peakboard OEE calculator on a touchscreen showing availability, performance and quality as the OEE result.
OEE Calculator
Enter planned values and actual figures – the OEE value is calculated and displayed straight away.
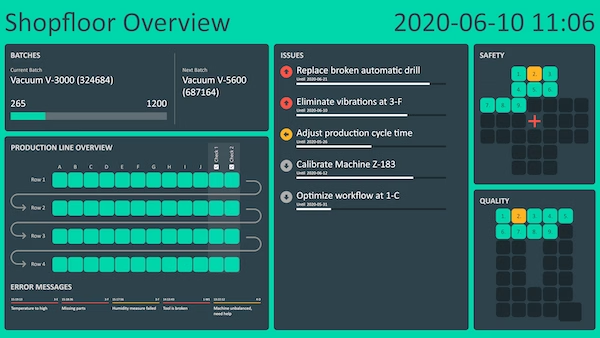
Peakboard digital shopfloor management dashboard showing safety and quality metrics overview
Digital shopfloor management
Production data, tasks and KPIs on one board – decide faster, spot problems earlier.
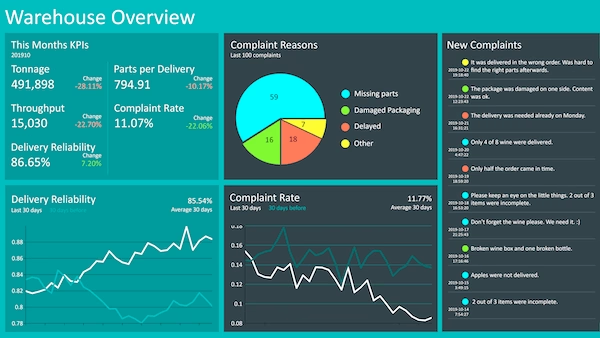
Peakboard strategic logistics board showing warehouse KPIs and productivity overview
Warehouse management
Control the warehouse rather than just observe it – goods receipt, picking and dispatch on one display, bottlenecks spotted early.
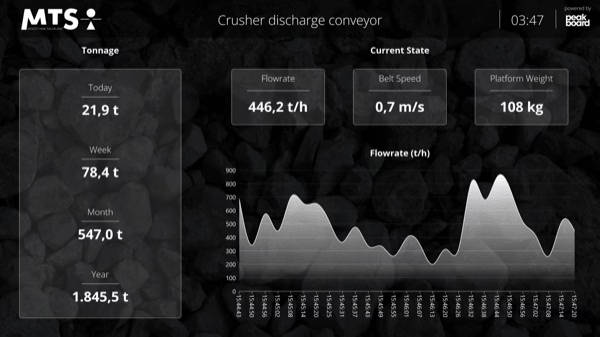
Peakboard dashboard showing conveyor belt scale data including flow rate and weight in real time
Conveyor scale monitoring
Keep throughput, belt speed and weights in view in real time – spot deviations instantly.
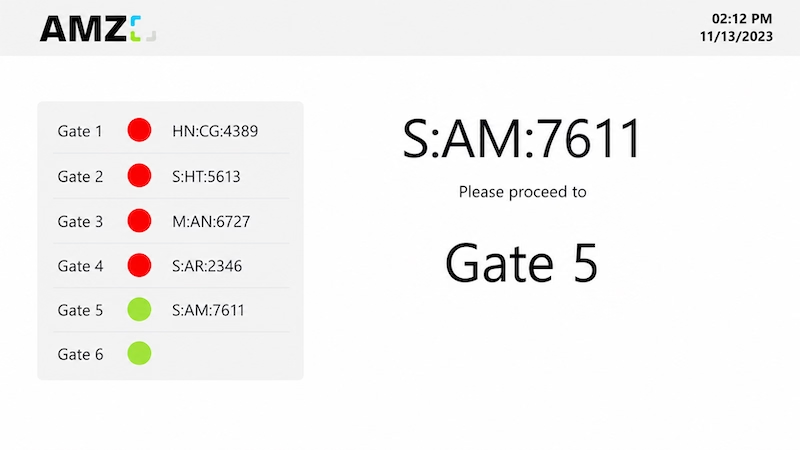
Peakboard dashboard showing real-time loading dock availability and truck assignments.
Yard management
Digital check-in, gate assignment and live tracking on one board – less congestion, shorter dwell times.
Peakboard touch application with step-by-step instructions guiding operators through a car wash process.
HMI for washing systems
Control the entire wash process safely – from vehicle detection to exit.
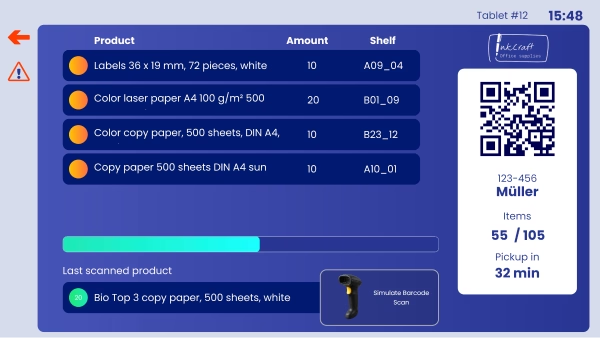
Peakboard paperless order picking app with product list, quantities, shelf locations and a QR code for the order.
Paperless order picking
Pick paper-free with real-time data – fewer errors and faster warehouse workflows.
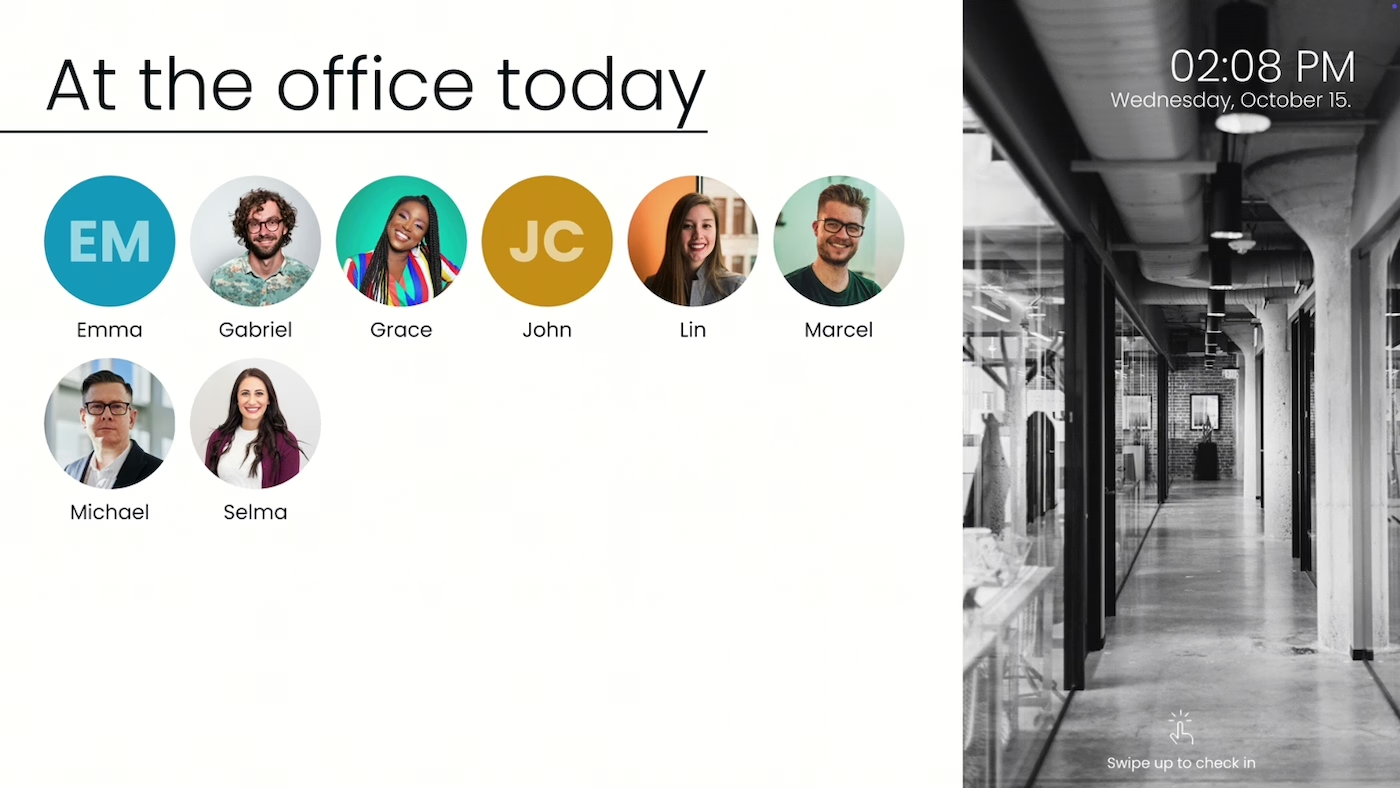
Peakboard office check-in app showing employees currently present in the office
Office check-in
Check in and out with one click – everyone sees instantly who is in the office.
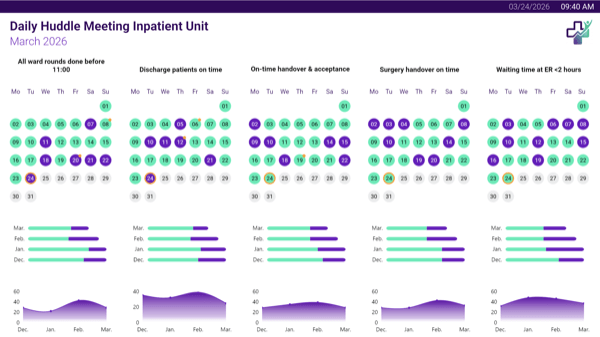
Peakboard digital huddle board for hospital daily management with team meeting metrics
Digital huddle board
Key KPIs for daily management clearly on the touchscreen – ready to document on the spot.

Test the Peakbot right here

Create and customize applications using AI

Peakbot usually works inside Peakboard Designer. Here you can try it without installing anything – describe your application and see what it builds.

  1. 1

    Beschreiben

    Was soll deine Anwendung zeigen? Ein paar Sätze reichen, oder setze einen unserer Beispielprompts ein.

  2. 2

    Per Mail erhalten

    Nach ein paar Minuten bekommst du den Link zu deiner Anwendung mit Beispieldaten – und die Projektdatei dazu.

  3. 3

    Im Peakboard Designer weiterbauen

    Öffne die Datei im kostenlosen Peakboard Designer, verbinde deine echten Datenquellen und pass alles an.

    Peakboard Designer herunterladen

Deine E-Mail-Adresse wird nicht gespeichert und ausschließlich für den Versand deiner Anwendung verwendet.

Peakbot is on it! In a few minutes you'll receive an email with the link to your application and the project file. To open it and keep building right away, download the free Peakboard Designer now.
Download Peakboard Designer
Something went wrong. Please try again. If the problem persists, please contact info@peakboard.com.

Connect over 100 data sources. Without integration project.

Any AI can build a slick interface these days. What matters is where the data comes from: a native SAP connector, OPC UA, MQTT and dozens of other sources are available out of the box. You simply connect instead of integrating – and the data goes straight to the shop floor.

  • ERP, MES & Databases
  • Machines & Industrial Hardware
  • Cloud & Office Services

Customise your applications yourself and save IT resources

A new KPI, a different layout, an additional data source: tell Peakbot – or adjust it yourself by drag and drop in Peakboard Designer. No coding skills required.

  • Create and change applications with a prompt
  • Everything Peakbot builds, you can see and change in Peakboard Designer
  • Preview mode with your own live data

Maintain full control over your data

Full Data Sovereignty
Data remains within your network
No Cloud, No Internet Required
Runs offline by default
No Single Point of Failure
Each device operates independently
Real-Time Access
Data directly at the source
Granular Access Control
Firewall & permissions per device
Enhanced Data Privacy
Sensitive data stays protected
Your Infrastructure
100 % on-premises · local & secure
Your Infrastructure
100 % on-premises · local & secure
Full Data Sovereignty
Data remains within your network
No Cloud, No Internet Required
Runs offline by default
No Single Point of Failure
Each device operates independently
Real-Time Access
Data directly at the source
Granular Access Control
Firewall & permissions per device
Enhanced Data Privacy
Sensitive data stays protected

Scale without sticker shock

Three employees on one display? A new use case on the same screen? That works without additional costs. Peakboard charges per device, not per user.

  • Pay-per-Device pricing model
  • Unlimited users
  • Unlimited applications
One production line
DISPLAYS ON SITE
1 Display

EMPLOYEES
18

Data Sources
SAPSQL

1 License
One license per display
An entire plant
Displays on site
4 Displays

EMPLOYEES
240

Data Sources
Rockwell AutomationSAPMQTTPower BIExcel

4 Licenses
One license per display

The four core components of the Peakboard Platform

01

Peakboard Designer

Create applications with a prompt using Peakbot and customise them by drag and drop.

Learn more
02

Peakboard Box

Compact industrial mini PC – runs applications and communicates directly with machines and sensors.

Learn more
03

Peakboard BYOD

Peakboard on your own hardware ("Bring Your Own Device").

Learn more
04

Peakboard Hub

Central management of all devices, data, and user permissions – historise data, access remotely, and use MCP.

Learn more
Find out more on our
Platform Overview

Used by industry experts
to cleverly simplify processes.

Precise workforce planning
No bottlenecks
Package volume at a glance
Würth Logistics | Commissioning | Dispatch Goodbye data gaps: Peakboard delivers a forecast for Würth Peakboard offers a solution that not only creates transparency in the packaging plant, but also in the entire order picking system. Markus Abel Project manager automation and digitisation in the packaging sector at Würth
Paperless manufacturing
No programming required
Works for employees without PCs
Siemens Industry, Infrastructure, and Building Technology How Siemens brings production data directly to the line Peakboard is a compact solution for quickly, easily, and visually appealingly bringing production data to the line, without complex programming or additional interface development. It supports employees, helping them to work efficiently with the right information in the right place. For us, Peakboard represents a significant step towards greater automation and efficiency. Izzet Kaplan IT Architect at Siemens in Rastatt
Self-service adjustments
Fewer system queries
Fast incident response
Rosenberger Group Manufacturing | Connectors and Cable Assemblies Manufacturing Complete monitoring of production “In the past, it was not only impossible to see the status of all machines at a glance, but it was also cumbersome to make adjustments to the displays. Today, information from multiple systems can be linked together and displayed on a single dashboard. This can be adjusted by us independently and easily, which significantly increases flexibility. ” Stefan Speigl IT Application Manager at Rosenberger
Cross-area transparency
Faster response times
Event-based via OPC UA
PistenBully Assembly, logistics, quality assurance | Special vehicles for slope, beach and environmental maintenance Assembly and logistics in sync with digital Andon boards Peakboard gives us a tool that makes visualisation and digitisation in the spirit of Industry 4.0 simple and practical to implement. Michael Hofmann Manufacturing planner
SAP & non-SAP in real time
Faster response times
Transparent logistics
Franz Binder Electrical engineering | Logistics How binder makes SAP and non-SAP data usable in real time with Peakboard "Peakboard enables us to pragmatically implement digitisation with minimal IT effort. The solution is intuitive to use, can be flexibly developed internally and ensures noticeable efficiency gains in our processes through transparent data provision. Our employees benefit from improved availability of information — and we as a company benefit from higher productivity and faster response times." René Spranger Strategic Logistics Team Leader, Franz Binder GmbH & Co. Elektrische Bauelemente KG
Better robot utilisation
Non-invasive retrofitting
More efficient scheduling
ZARGES Production | Light metal construction Optimum robot utilisation through visualisation of production “Easy implementation and use was important to us. Peakboard offered many standards in the SAP environment and was able to integrate all data sources without programming effort. In addition, even before making the decision, I noticed that we could use the graphical interface intuitively and easily adapt it. ” Martin Lemmer Head of IT EMEA at ZARGES
40% shorter processing time
Lower error rate
More efficient with RFID
Bizerba IT, logistics, production | Metal industry and processing Turnaround time optimised by 40 percent “At first glance, the complete digitisation of our processes appeared to us as a mammoth task. However, we quickly realised that this change was a decisive step towards operational excellence. ” Yasin Öztürk Digitalisation Project Manager at Bizerba
Clear target vs. actual
Department implements independently
Visual assembly cycle time
Claas Logistics, production | Agricultural machinery manufacturer From Lento to Allegro: The Conductor in Assembly “The system should be ready for use quickly in order to be able to display the cycle time and system messages when an AGV is introduced. However, it should also be flexible enough to be able to display information from other interfaces at a later stage. ” Carsten Warzecha Project Engineer at CLAAS
Status per lab room
Key metrics at a glance
Information right on-site
GBA Group Organisation | Laboratory Lab communication 4.0 “With Peakboard, information is now quickly and transparently available right where it is needed and seen. ” Sandra Schubert Process optimisation at GBA Group
Real-time planning
Machine status at a glance
All data sources integrated
BWI Group Production | Production of Brake and Suspension Systems Real-Time Data Visualisation for Increased Productivity “Using Peakboard has improved our quality, increased efficiency and motivated employees. The implementation was extremely fast. Overall, it was a small step with a big impact.” Jordan Marlin Manager Operational Technology, Industry 4.0 Engineering at BWI
Clear target vs. actual
Targeted root cause analysis
ERP data visualised
Hightech-Electronic Electronics manufacturing / electronic assemblies and devices How Hightech-Electronic uses Peakboard to run the shop floor with greater transparency When material, a tool or a preliminary product is missing, that is not an individual performance problem but a process problem. With Peakboard we can see at every station where time is lost and why. In the past, such issues were spotted at best in random samples, and often only once the damage was done. Klaus Bauer Managing Director, Hightech-Electronic GmbH
SAP data visualised
Transparent workloads
More efficient scheduling
Prym Group Warehouses | Metal industry and processing Warehouse transparency with Peakboard “With Peakboard, we have a quick and efficient way to make adjustments to the distribution of work. ” Thomas Hösch SAP organisation and project management at Prym Group
Real-time without IT effort
Faster error response
Standardised SAP connection
Helmut Fischer Logistics, production, quality assurance, purchasing | Electronics/Measurement technology Goodbye paper: Helmut Fischer uses digital shop floor management “Only Peakboard met our requirements for standardised interfaces to various systems, in particular SAP, and the visualisation of shop floor data in real time and without programming. ” Andre Fimpel Head of Lean Management at Helmut Fischer GmbH
Implemented without support
Scrap data in real time
Automated data processing
Aquis Systems Production | Sanitary engineering So that the production of faucets flows better “After a few short conversations with Peakboard and watching the online videos provided, I was able to design the interface myself without the help of the Peakboard team, right down to the integration of our corporate identity. ” Denis Maljkovic Head of Production and Industrialization at Aquis
Centrally managed via Hub
Aligned information across teams
Less coordination overhead
Scholz GmbH + Co. KG Production, Packaging, Quality Assurance, Assembly, internal information areas How SCHOLZ centrally provides priorities, shift information, and production data with Peakboard Peakboard makes complex data easily accessible for us. The solution is intuitive, works very well with touchscreens, and helps us keep a clear overview of priorities in our daily work. Anna-Lena Scharf Working student in Data Analysis
Orders visible to all
ERP data visualised
Real-time actual state
Johannes Giesser Messerfabrik Manufacturing, foreman's office | Metal processing industry Giesser sharpens blade production with process data visualisation “By using Peakboard, we have become faster and more precise in our processes. The newly gained transparency also reveals further potential for process optimisation, which we will gradually use. ” Björn Mutschler Production manager at Johannes Giesser Messerfabrik GmbH
USD 20,000 saved per year
Dashboards built in-house
Productive on day one
L&S Machine Company Manufacturing | Mechanical Engineering | CNC Machining How L&S Machine Company Visualises CNC Data in Real Time Working with Peakboard and Catalyst Connection has been a great experience. Everyone has been very responsive and open to ideas, and it really feels like a partnership rather than just a vendor relationship. Jason Smathers Manufacturing Manager
Transparent order priority
SAP & Qlik integration
KPIs at a glance
Hermes Schleifmittel Production | Abrasives manufacturer Increasing delivery reliability with real-time applications “Our main goal was initially to significantly reduce delivery times and at the same time increase delivery reliability so that our customers are guaranteed to receive their orders on time.” Sven Russmeyer Plant manager at Hermes
Reaches more employees
Replaces email lists
On-time delivery at a glance
Joh. Clouth GmbH & Co. KG Suppliers to the paper and steel industry | production, administration With Peakboard to the digital bulletin board “We like the simple operation of the Peakboard Designer and that complex designs can still be created with LUA. The first-class support from Peakboard and the speed with which new functions are implemented should be clearly emphasised. ” Marc-Philip Stüttem Head of IT at Joh. Clouth GmbH & Co. KG
Better planning & logistics
Targeted root cause analysis
Order overview
Pankl Racing System Manufacturing | Racing, Luxury Automotive and Aerospace Industries From magnetic board to real-time dashboard “We needed a central presentation of current production data on an Andon board to take the next big step towards operational excellence. Employees should be able to see the status of their system in real time: What is running on my machine here and now? The solution to be selected should also be able to become the standard in our Group so as not to work with a large number of different systems. ” Mario Pichler Head of Automation at Pankl Racing Systems AG
No more manual effort
End-to-end digital
Repair status at a glance
MUNSCH Kunststoff-Schweißtechnik Precision engineering | Mechanical engineering Real-Time Data Visualisation for Increased Productivity “With Peakboard, we have achieved efficiency through greater transparency. Employees can see the current status at a glance directly at the workplace and steer their work steps accordingly. ” Oliver Herz Head of Application Development at MUNSCH Group
Faster issue detection
All shopfloor data unified
Corratec Assembly | Bicycle production Smart factory made easy “We created the dashboard ourselves: download the Peakboard Designer, select the components to be displayed, order and set up the Peakboard Box. With knowledge of automation structures, it was easy. There was also a lot of learning by doing and it was fun,” says Sagberger. “The first implementations were up and running after just one week. ” Ralph Sagberger Head of Organisation & Production at Corratec
Full order visibility
MES set up quickly
Real-time status
Bon EOOD Production | Pet food More than just low-code visualisation “The effects were consistently positive. The overall effectiveness of production has increased and our planning is more accurate. Our processes have also significantly accelerated thanks to MES functions. Our teams are even more motivated than before and develop sporting ambition to achieve the goals.” Mityo Dryankov Director of Maintenance, Innovations and Technology at Bon EOOD

Two ways to get to know Peakboard

Start Immediately · No Appointment · Free

Start now with Peakboard

The download is the full version – Peakbot included. If you need support: You'll find tutorials and step-by-step guides on our Helpsite and our YouTube channel.
‍
For individual needs, we offer workshops and consulting.

In Conversation · With Industry Experts · 55 Min.

Book a Personal Demo

Discuss your specific use case with an industry expert – provide brief information about your use case beforehand, and we'll get straight to the point. ‍ You'll get a complete overview of all features and see what's possible with Peakboard in your environment.

Frequently Asked Questions

What is Peakboard?
Allgemeine Fragen

Peakboard is a platform for building applications for manufacturing and logistics and running them on the shop floor – with real-time data from machines, sensors and IT systems such as SAP. You create applications with a prompt using Peakbot or by drag and drop in Peakboard Designer, and you can freely combine both. They run on the Peakboard Box or on your own hardware (BYOD) and are managed centrally via Peakboard Hub.

Who is Peakboard built for?
Allgemeine Fragen

Peakboard is aimed at mid-sized and larger production and logistics companies, primarily in DACH and the US. Typical users are OPEX managers, lean managers, digitalisation leads and production managers. The focus is on companies that want to bring together machine data and business-team applications without large classic IT projects.

What sets Peakboard apart from other providers?
Allgemeine Fragen

Four points:

  1. On-Premise as standard – no cloud lock-in, no US dependencies, supports GDPR-compliant setups.
  2. Device-based pricing from EUR 49/month instead of user-based licences, avoiding cost explosions as you scale.
  3. SAP-certified connector for EWM, ECC, MES, S/4 HANA – with roots in the ecosystem of Theobald Software, a long-established SAP interface vendor.
  4. Business-team autonomy – OPEX and lean teams build and modify applications themselves, at their own pace and close to the process.
Is Peakboard an MES, a BI tool or something else?
Allgemeine Fragen

Neither. Peakboard is an edge-computing platform that sits between data acquisition (PLC, SCADA) and planning (ERP, MES, BI tools). Unlike MES systems, Peakboard is not monolithic and not built for multi-year implementation projects. Unlike BI tools such as Power BI, Peakboard offers real-time updates (per-second instead of periodic), a feedback channel from the shop floor and direct machine connectivity via OPC UA.

Who is behind Peakboard?
Allgemeine Fragen

Peakboard GmbH was founded in Stuttgart in 2016 and spun off in 2022 as an independent company from Theobald Software, a long-established SAP interface vendor. The company serves over 300 customers in DACH and the US and operates from multiple locations. Peakboard America Inc. was founded in Chicago in 2022.

Does AI make Peakboard obsolete? Can't I just prompt it as a web app?
Allgemeine Fragen

No – AI is already built into Peakboard: with Peakbot, you create applications from a prompt. The difference lies in what happens next. A generic AI app builder gives you code that you have to connect to your systems, run and maintain yourself. Peakboard comes with everything an application needs on the shop floor: over 100 native interfaces to machines, PLCs and SAP, continuous operation on the Peakboard Box or your own hardware, and on-premises operation in your network. And instead of a black box, you get Peakboard Designer, where you can follow and change every detail by drag and drop.

Read more in the blog post: Industrial Vibe Coding: What Generic AI App Builders Miss on the Shop Floor.
Find answers to more questions – visit our  
FAQ Page